
2013 Church Budget Allocations, Learning Priorities, and Quarterly Financial Trends
SUMMARY
In December 2012, we asked members of ECCU’s exclusive Ministry Advisory Panel (MAP)* about their 2013 budget allocations based on 32 budget line-items and 5 expense categories. We also asked which topics would be of interest to them for future ECCU resources. Finally, we captured churches’ financial performance and other key metrics from the third quarter of 2012.
Here are some key findings:
- Although budget allocations differ significantly when compared to a 2009 Christianity Today International survey, on average, they remain consistent across churches of varying sizes.
- The personnel expense category received the highest budget allocation by responding churches with an average of 58%.
- 9% of the survey respondents are reducing or excluding programs from their 2013 budgets because of a lack of funds or other resource constraints, while 3% are expanding their programs.
- The topics of greatest interest to survey respondents were donor behavior (34%) and digital giving (26%).
* The MAP is composed of ECCU member and non-member ministry staff and leaders representing evangelical Christian churches, businesses, schools, and other ministries. This report was produced by ECCU’s research department.
2013 BUDGET ALLOCATIONS
Most economists expect 2013 to be a year of recovery, continuing the momentum from 2012 and culminating with the end of federal economic stimulus programs in early 2014. Despite this popular sentiment, economic results such as the GDP being down 0.1% in the fourth quarter of 2012 and greater-than-expected jobless claims in January 2013 reinforce the need for ministries to remain cautious and not to overestimate economic recovery in 2013.
Based on the data gathered from this survey, it appears that churches are realigning their budget priorities differently in some areas than they were in 2009 when NationalChristianPoll.com conducted a survey for Christianity Today International (CTI) on the subject of “Church Budget Priorities.”
In December’s MAP survey, we asked panelists for a detailed breakdown of their 2013 budgets. Below is the complete summary of budgeted expenses by church size. In the far right column we’ve included each line item’s average for all church segments.

Because the numbers above are averages, it’s hard to discern significant differences among church size segments; but here are some observations that stood out:
- The following expense items were not budgeted for: Grants, Contracts, and Direct Assistance; Scholarships/Tuition Forgiveness; and Debt Retirement Fund
- Large churches budgeted significantly more for facilities/occupancy expenses than other size segments (29%, followed by 18% at small churches).
This chart illustrates the category averages:

From this perspective, it’s easier to appreciate certain differences more clearly.
We compared these findings to the 2009 CTI survey. The 32 budget line items in our December MAP survey and the 11 budget line items in their survey combine easily into 7 budget categories. The chart below compares our survey findings, by church size segment, with their survey findings, which include all churches regardless of size.

Note the significantly lower personnel expenses in the 2009 CTI survey. It’s hard to tell the reasons for this 19% difference, but it might be related to the drastic actions churches were taking to reduce expenses in 2009, including salary freezes, pay cuts, and layoffs.
Micro churches had the highest personnel expense, but the lowest maintenance/cleaning and building expenses compared to all other size segments.
FINANCIAL LEADERS’ LEARNING PRIORITIES
ECCU provides financial professionals at evangelical ministries with learning opportunities throughout the year. The goal is to help them become more effective at financial management so they can focus their efforts on fulfilling their ministries’ missions. We asked the MAP panelists which of these 13 topics would be of interest to them for future ECCU resources. Here’s how they responded:

Increasing revenue remains the foremost concern among most ministry financial leaders. Transactional concerns like account utilization and reconciliation are of least interest to them.
CHURCH FINANCIAL TRENDS THROUGH Q3 2012
Results are in for the third quarter of 2012. It seems that economic conditions continue to be most challenging for the smallest ministries (i.e., churches with weekend worship adult attendance of less than 200).
Quarterly financial trends have been captured in this format since the second quarter of 2010 (base period). Ministries are segmented by type and size each reporting period. The type and size segmentation framework used is as follows:
(Every effort is made to ensure a broad representation of ministries by type and size, but seasonality and the overall nature of online survey panels impact our ability to provide statistically significant results. Where statistical significance cannot be achieved, the results are omitted.)

Churches
This is the quarterly revenue change index beginning with the Q2 2010 base period:

Seasonality plays a big role in these results as the third quarter tends to be a challenging season for many churches. Small churches seemed to buck the trend, as well as large ones to a lesser extent.
Here is another way of looking at the information presented in the table above:

The following table represents a running quarterly attendance change index beginning with the Q2 2010 base period:

During the second quarter of 2012, we saw a rare spike in micro church attendance. That spike quickly disappeared in the third quarter, leading to a declining trend from the baseline period of 22%. Overall, however, attendance seems to have increased, but his may be due to seasonal attendees rather than additional giving units.
Here is another way of looking at the information presented in the table above:

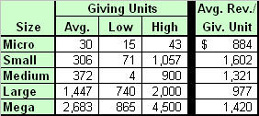
The following two tables report attendance and revenue averages by church size for the third quarter of 2012. The “Low” figure represents the lowest reported number in its segment. The “High” figure represents the highest reported number in its segment.

This table shows the average revenue per church attendee, the previous quarter’s average revenue per church attendee, and the percent difference between the two.

To better represent the metrics that are most indicative of a ministry’s financial health, we captured the average number of giving units in addition to adult attendance. Although the definition of a giving unit varies by ministry, 46% of ministries track giving in this manner. The method least used (7%) is giving per member. The table below represents the first period of such data and will be the basis for comparison in future reports.
Commentary:
Although our panelists are clearly interested in learning how to increase their ministries’ revenue, it’s important to note that another way to improve cash flow is by increasing efficiency to reduce operational expenses. One way to achieve the latter is by optimizing your banking accounts and transaction activity. Reach out to your primary bank and ask for a banking assessment to be sure you are maximizing your return and minimizing fees.
If you found this survey report helpful, please pass it along to other members of your ministry team and peers using the Share with a Friend tool below.
- Share with a Friend
- Subscribe
- Call: 877.545.0755
- How can we help you?

