|
|
BACKGROUND CHARACTERISTICS
BACKGROUND INFORMATION
INTRODUCTION
The modern economy is marked by an increasing demand for information-processing skills and other high level cognitive and interpersonal skills. The availability and appropriate use of these skills is essential for continuing growth in economic productivity (see OECD Skills Outlook 2013: First Results from the Survey of Adult Skills. The report is available from the OECD website at www.oecd.org). Individuals with poorer skills are at risk of not being able to participate fully in the labour market, education and training and social and civic life. The 2011–12 Programme for the International Assessment of Adult Competencies (PIAAC) was developed to provide a greater understanding of the availability of key skills in society and their use at work and at home, in participating countries. The distinctive component of PIAAC was the direct measurement of three critical information-processing skills: literacy; numeracy; and problem solving in technology-rich environments (PSTRE). For people with the required computer skills, this was done on a notebook computer. People without these skills were able to undertake a paper-based test for literacy and numeracy. PIAAC also collected information on demographic characteristics, education and training, employment, income and skill use in everyday life and at work. For more detail refer to the PIAAC Data Item List available from the Downloads tab of this publication.
ABOUT THIS SURVEY
The following commentary presents data for the 2011–12 Programme for the International Assessment of Adult Competencies (PIAAC). Respondents to this survey completed tasks designed to assess their skills in literacy, numeracy and PSTRE. Scores for each skill were derived on a scale ranging from 0 to 500 points before being grouped into levels. |
For literacy and numeracy, proficiency scores have been grouped into six skill levels with Below Level 1 being the lowest level and Level 5 the highest. For PSTRE scores have been grouped into four skill levels with Below Level 1 being the lowest level and Level 3 the highest. For a full description of the skill levels, refer to Scores and skill levels.
For PSTRE, respondents who did not undertake information-processing tasks were included in the 'Not classified' category, which covered people who had 'No computer experience', 'Opted out of computer based assessment' and 'Failed Information and Communication Technology Core'.
For all three domains, literacy, numeracy and PSTRE, a 'missing' category exists for respondents who did not receive a proficiency score because they did not answer sufficient questions in the background questionnaire.
Previously released in ALLS and SAL publications are not directly comparable with PIAAC data. For further information refer to the Data Comparability section of the Explanatory Notes.
SKILL LEVELS IN LITERACY, NUMERACY AND PROBLEM SOLVING IN TECHNOLOGY-RICH ENVIRONMENTS
Around 3.7% (620,000) of Australians aged 15 to 74 years had literacy skills at Below Level 1, a further 10% (1.7 million) at Level 1, 30% (5.0 million) at Level 2, 38% (6.3 million) at Level 3, 14% (2.4 million) at Level 4, and 1.2% (200,000) at Level 5.
Proportion at each literacy level—2011–12

For numeracy, the figures were somewhat lower. Close to 6.5% (1.1 million) of Australians had numeracy skills at Below Level 1, 15% (2.5 million) at Level 1, 32% (5.4 million) at Level 2, 31% (5.2 million) at Level 3 , 11% (1.8 million) at Level 4 and 1.4% (230,000) at Level 5.
Proportion at each numeracy level—2011–12

For PSTRE, an estimated 25% (4.2 million) of Australians aged 15 to 74 years were not classified. Just over 13% (2.2 million) of Australians were assessed at Below Level 1 and 31% (5.3 million) were assessed at Level 1. Around 25% (4.1 million) had skills at Level 2, and 3.2% (540,000) at Level 3.
Proportion at each PSTRE level—2011–12

SEX
There were only minor differences between men and women for literacy and PSTRE. Overall, 44% (3.7 million) of men and 45% (3.7 million) of women had literacy skills at Level 2 or below. Fifty four per cent (4.5 million) of men and 53% (4.4 million) of women were assessed at Level 3 or above.
Similarly, for PSTRE, 24% (2 million) of men were not classified, while 46% (3.8 million) of men were assessed at Level 1 or below and 29% (2.4 million) at Level 2 or above. In comparison, 26% (2.2 million) of women were not classified while 44% (3.7 million) of women were assessed at Level 1 or below and 27% (2.3 million) at Level 2 or above.
In contrast, for numeracy there was a marked difference by sex. Approximately 49% (4.1 million) of men had skills at Level 2 or below, and 49% (4.1 million) at Level 3 or above, compared to 59% (4.9 million) of women at Level 2 or below and 38% (3.2 million) at Level 3 or above.
AGE
One of the main objectives of PIAAC was to measure variation in skill levels by age. The literacy and numeracy domains were characterised by an increase in assessed scores from the youngest age group, plateauing in the late 20s, and then declining from the late 40s. For example, the percentage of people with literacy skills at Level 3 or above was 54% for people aged 15 to 19 years, 63% for people aged 25 to 34 years, 54% for people aged 45 to 54 years and 28% for people aged 65 to 74 years. The percentage of people with numeracy skills at Level 3 or above was 42% for people aged 15 to 19 years, 51% for people aged 25 to 34 years, 45% for people aged 45 to 54 years and 24% for people aged 65 to 74 years. A factor in this age pattern may be the impact of education and work experience. Young people are still gaining education and experience, while elderly people have lower levels of educational attainment.
The situation for PSTRE is complicated by the high proportion of people 'not classified' at older ages, many of whom lacked the basic mouse skills required to undertake the computer-based test. The proportion of respondents who were not classified increased from around one in ten for the youngest age groups to almost 60% for the oldest age group, 65 to 74 years.
Younger women had relatively higher scores in literacy, numeracy and PSTRE compared to men than older women. Fewer older women had literacy skills at Level 3 or above, than their male counterparts, but among the youngest age groups there was no significant difference. The situation was similar for PSTRE, where older women were less likely than older men to be at Level 2 or above, but among younger people there was no significant difference. For numeracy, more men were assessed at Level 3 or above than women at all ages, but the difference, which was 10 percentage points or higher for older ages, was lower for younger ages.
Proportion at literacy Level 3 or above, By sex and age group—2011–12

Age group (years)
Proportion at numeracy Level 3 or above, By sex and age group—2011–12

Age group (years)
Proportion at PSTRE Level 2 or above, By sex and age group—2011–12

Age group (years) |
STATE AND TERRITORY
There were small differences in the proficiency scores for the three domains by state or territory, with the exception of the Australian Capital Territory (ACT) which had a larger proportion of people at higher levels in all domains. In the ACT, 67% were at literacy Level 3 or above, followed by 56% in Queensland. The numeracy figures were led by the ACT with 59% at Level 3 or above, followed by Queensland with 46%. The ACT also scored highest for PSTRE with 44% at Level 2 or above, followed by Victoria with 29%.
Proportion at literacy Level 3 or above, By state or territory of usual residence and sex—2011–12
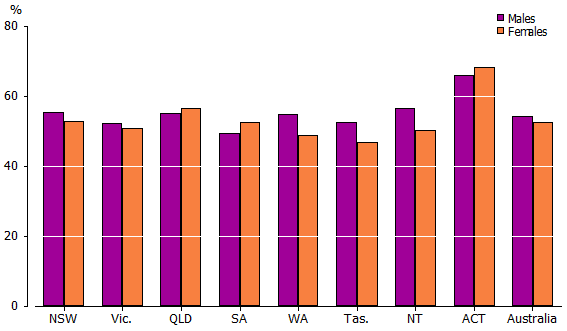 Proportion at numeracy Level 3 or above
, By state or territory of usual residence and sex—2011–12

Proportion at PSTRE Level 2 or above, By state or territory of usual residence and sex—2011–12

This page last updated 24 March 2014
|
|


 Quality Declaration
  Print Page
 Print All

 RSS
RSS
 Search this Product

