Indicator: CO-30 Length and area of coastal and estuarine foreshore altered for human purposes
Data
Total Length of the Australian Coast (excluding all offshore islands) is 34,218 km.
(The Coastline for Australia was derived from the Australia 1:100,000 Topographic Administration Boundaries and Coastline produced by Geosciences Australia.)
Remote sensing data has been used to show changes in the extent of the human occupied foreshore in each jurisdiction since 1980.
The following analysis translates the changes observed by remote sensing into kilometres and proportions urbanised at various points in time.
Coastal Urban Expansion Assessment
| State | 1980 (km) | 1989 (km) | 2004 (km) | Total Coast Length (km) |
|---|---|---|---|---|
| CW | 1 | 1 | 1 | 36 |
| NSW | 438 | 490 | 524 | 1973 |
| NT | 26 | 29 | 36 | 5438 |
| QLD | 381 | 429 | 474 | 6967 |
| SA | 182 | 232 | 251 | 3815 |
| TAS | 148 | 185 | 267 | 2827 |
| VIC | 270 | 298 | 311 | 1870 |
| WA | 217 | 271 | 299 | 12913 |
| 1663 | 1935 | 2163 | 35839 | |
| Proportion of urbanisation | 77% | 89% | 100% |
Source: Derived from AGO [Australian Greenhouse Office] 2006, unpublished data, Australian Greenhouse Office, Department of the Environment and Heritage
| Year | 1980 | 1989 | 2004 |
|---|---|---|---|
| Total (%) | 4.6 | 5.4 | 6.0 |
Source: Derived from AGO [Australian Greenhouse Office] 2006, unpublished data, Australian Greenhouse Office, Department of the Environment and Heritage
| State | 1980 (%) | 1989 (%) | 2004 (%) |
|---|---|---|---|
| CW | 1.94 | 2.78 | 2.78 |
| NSW | 22.20 | 24.84 | 26.56 |
| NT | 0.48 | 0.53 | 0.66 |
| QLD | 5.47 | 6.16 | 6.80 |
| SA | 4.77 | 6.08 | 6.58 |
| TAS | 5.24 | 6.54 | 9.44 |
| VIC | 14.44 | 15.94 | 16.63 |
| WA | 1.68 | 2.10 | 2.32 |
| Australia-wide | 4.64 | 5.40 | 6.04 |
Source: Derived from AGO [Australian Greenhouse Office] 2006, unpublished data, Australian Greenhouse Office, Department of the Environment and Heritage
| State | 1989 - 1980 (km) | 2004 - 1989 (km) | 2004 - 1980 (km) | |
|---|---|---|---|---|
| CW | 0 | 0 | 0 | |
| NSW | 52 | 34 | 86 | |
| NT | 3 | 7 | 10 | |
| QLD | 48 | 45 | 93 | |
| SA | 50 | 19 | 69 | |
| TAS | 37 | 82 | 119 | |
| VIC | 28 | 13 | 41 | |
| WA | 54 | 28 | 82 | |
| Australia-wide | 272 | 228 | 500 |
Source: Derived from AGO [Australian Greenhouse Office] 2006, unpublished data, Australian Greenhouse Office, Department of the Environment and Heritage
| 1980-1989 | 1989-2004 | 1980-2004 | |
|---|---|---|---|
| Average per year | Average per year | Average per year | |
| CW | 0.03 | 0.00 | 0.001 |
| NSW | 5.78 | 2.27 | 3.58 |
| NT | 0.33 | 0.47 | 0.42 |
| QLD | 5.33 | 3.00 | 3.88 |
| SA | 5.56 | 1.27 | 2.88 |
| TAS | 4.11 | 5.47 | 4.96 |
| VIC | 3.11 | 0.87 | 1.71 |
| WA | 6.00 | 1.87 | 3.42 |
| Australia-wide | 30.26 | 15.20 | 20.83 |
Source: Derived from AGO [Australian Greenhouse Office] 2006, unpublished data, Australian Greenhouse Office, Department of the Environment and Heritage
| length (km) | Overshoots (km) | Undershoots (km) | Spatial error | Statistical error | |
|---|---|---|---|---|---|
| Melbourne Coast | 202.00 | 0.00 | 1.24 | 0.613861386 | 1.24 |
| Perth Coast | 317.00 | 2.81 | 1.99 | 1.514195584 | 0.82 |
| Sydney Coast | 175.00 | 4.70 | 0.50 | 2.971428571 | 4.2 |
| 1.70 | 2.09 |
Source: Derived from AGO [Australian Greenhouse Office] 2006, unpublished data, Australian Greenhouse Office, Department of the Environment and Heritage
Development from Nowra to Noosa on the east coast before 1980, between 1980 and 1989 and since 1989 are shown on the following three maps.
Nowra to Noosa - Length of Urbanised Coastline to 1980

Source: Derived from AGO [Australian Greenhouse Office] 2006, unpublished data, Australian Greenhouse Office, Department of the Environment and Heritage
Location of Growth in Urbanised Coastline Nowra to Noosa 1980-1989

Source: Derived from AGO [Australian Greenhouse Office] 2006, unpublished data, Australian Greenhouse Office, Department of the Environment and Heritage
Location of Growth in Urbanised coastline Nowra to Noosa 1989-2004

Source: Derived from AGO [Australian Greenhouse Office] 2006, unpublished data, Australian Greenhouse Office, Department of the Environment and Heritage
Some specific areas along this coastline are shown in the following figures. The satellite image showing the change in extent of urbanised land is followed by the same development transferred to a topographic map.
Port Stephens
Urbanised coastline 1980-2004, Nelson Bay, NSW

Source: Derived from AGO [Australian Greenhouse Office] 2006, unpublished data, Australian Greenhouse Office, Department of the Environment and Heritage
Urbanised coastline 1980-2004, Nelson Bay, NSW

Source: Derived from AGO [Australian Greenhouse Office] 2006, unpublished data, Australian Greenhouse Office, Department of the Environment and Heritage
Wollongong
Urbanised Coastline 1980-2004, Wollongong, NSW
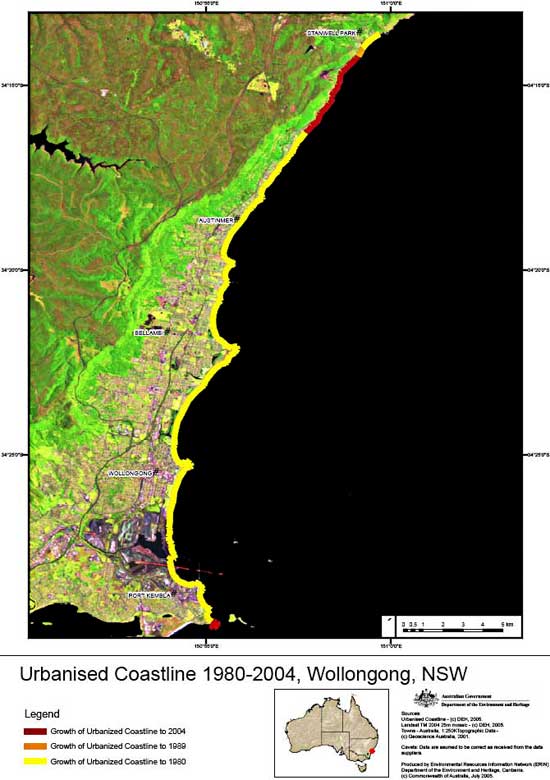
Source: Derived from AGO [Australian Greenhouse Office] 2006, unpublished data, Australian Greenhouse Office, Department of the Environment and Heritage
Urbanised Coastline 1980-2004, Wollongong, NSW

Source: Derived from AGO [Australian Greenhouse Office] 2006, unpublished data, Australian Greenhouse Office, Department of the Environment and Heritage
Stanwell Park
Urbanised Coastline 1980-2004, Stanwell Park, NSW

Source: Derived from AGO [Australian Greenhouse Office] 2006, unpublished data, Australian Greenhouse Office, Department of the Environment and Heritage
Urbanised Coastlines 1980-2004, Stanwell Park, NSW

Source: Derived from AGO [Australian Greenhouse Office] 2006, unpublished data, Australian Greenhouse Office, Department of the Environment and Heritage
The following analysis translates these changes into kilometres.
| Year | KM | Proportion % |
|---|---|---|
| 1980 | 510 | 28.1 |
| 1989 | 559 | 30.8 |
| 2004 | 601 | 33.1 |
Source: Derived from AGO [Australian Greenhouse Office] 2006, unpublished data, Australian Greenhouse Office, Department of the Environment and Heritage
Urbanised Coastline 1980-2004, Nowra NSW to Noosa Heads QLD
Source: Derived from AGO [Australian Greenhouse Office] 2006, unpublished data, Australian Greenhouse Office, Department of the Environment and Heritage
| Coast Length | KM |
|---|---|
| Total | 1815 |
| CAPAD Length | 571 |
Source: Derived from AGO [Australian Greenhouse Office] 2006, unpublished data, Australian Greenhouse Office, Department of the Environment and Heritage
| Length (km) | Length % | |
|---|---|---|
| Total Length | 1815 | 100 |
| Urban 04 Length | 601 | 33 |
| CAPAD Length | 571 | 31 |
| Forest Extent 2004 (not in reserves) | 304 | 17 |
| Other | 238 | 13 |
Source: Derived from AGO [Australian Greenhouse Office] 2006, unpublished data, Australian Greenhouse Office, Department of the Environment and Heritage
Coastline Analysis is Nowra to Noosa

Source: Derived from AGO [Australian Greenhouse Office] 2006, unpublished data, Australian Greenhouse Office, Department of the Environment and Heritage
| Average growth/year (%) | Proportion of urbanised coast by 2050 at 0.2% growth per year (%) |
|---|---|
| 0.2 | 42.3 |
Source: Derived from AGO [Australian Greenhouse Office] 2006, unpublished data, Australian Greenhouse Office, Department of the Environment and Heritage
Development in the Peel inlet area on the west coast over the same period is shown in the following maps.
Urban Coastline 1980-2004, Manurah, WA

Source: Derived from AGO [Australian Greenhouse Office] 2006, unpublished data, Australian Greenhouse Office, Department of the Environment and Heritage
Urbanised Coastline 1980-2004, Mandurah, WA

Source: Derived from AGO [Australian Greenhouse Office] 2006, unpublished data, Australian Greenhouse Office, Department of the Environment and Heritage
The spatial expansion data, which show the actual extent of coastal habitat displaced by human habitation, is also reflected in the population statistics which show a steady growth of population in coastal settlements.
Size and density changes in estimated resident population of coastal areas in Australia, 1996-2004
| Coastal areas (as defined by Statistical Local Areas) a | Area b ('000 km²) |
Estimated resident population ('000s) |
Average annual population change (% c ) | |||
|---|---|---|---|---|---|---|
| 1996 | 2001 | 2004 | 1996-2001 | 2001-2004 | ||
| All coastal areas | 2163.1 | 7482.0 | 7971.7 | 8283.5 | 1.3 | 1.3 |
| Coastal areas excluding capital cities | 2149.2 | 2977.7 | 3193.4 | 3339.6 | 1.4 | 1.5 |
| Coastal areas within capital cities | 13.8 | 4504.4 | 4778.3 | 4943.9 | 6.1 | 3.5 |
| Australia | 7705.3 | 18310.7 | 19413.2 | 20111.3 | 1.2 | 1.2 |
Notes:
a. Coastal areas are all Statistical Local Areas (SLAs) with a boundary adjoining the sea, including those with boundaries adjoining harbours and rivers, such as Leichhardt (A) in Sydney harbour and South Perth (C) on the Swan River in Perth. Note that many SLAs extend inland for large distances (for example, East Pilbara Shire in Western Australia has a coastline of roughly 80 kilometres and an area of over 350,000 square kilometres)
b. Based on 2004 Australian Standard Geographic Classification (ASGC) boundaries
c. Average annual growth rate
Source: Australian Bureau of Statistics 2004, Australian Demographic Statistics Australia December 2004, Australian Bureau of Statistics, Canberra, viewed 29 Nov 2005, http://abs.gov.au/ausstats/abs@.nsf
/Lookup/77EE7ED06DC9236BCA2568BD0012E582.
What the data mean
Just over 6% of Australia's coastline was urbanised as at 2004, an increase of about 1.4% or 500 kilometres since 1980. The extent of urbanisation varies considerably between States. In NSW the proportion of urbanised coastline is about 26.6% while in Western Australia, the proportion is 2.3% and in the Northern Territory less than 1%.
About 77% of the current urbanisation took place before 1980 in all States except Tasmania and the Northern Territory.
In 1980, 1,663 km or 4.6% of the Australian coast was urbanised.
In 1989, 1,935 km or 5.4% was urbanised.
In 2004, 2,163 km or 6.0% was urbanised.
In 2004 the proportions of coastline of each State that has been urbanized are:
- NSW: 26.6%
- VIC: 16.6%
- TAS: 9.4%
- QLD: 6.8%
- SA: 6.6%
- WA: 2.3%
- NT: 0.7
The analysis of the extension of urban development on the coastline from Nowra (NSW) to Noosa (Queensland) is even more dramatic, extending by 49 kilometres (2.7%) in the nine years from 1980 and 1989 - an average of 5.4 kilometres per year and by 42 kilometres (2.3%) in the fifteen years from 1989 to 2004, an average of 2.8 kilometres a year.
Just under a third (571 kilometres) of Nowra to Noosa coastline is identified as protected areas (parks and reserves) in the Collaborative Protective Areas Database (CAPAD). The remaining 542 kilometres is likely to be either agricultural land or unprotected native vegetation. The unprotected native vegetation, particularly the corridors surrounding coastal rivers, lakes and estuaries, are the areas of coastal habitat most immediately at risk of continued urbanisation.
Data Limitations
The analysis of remote sensing data show how much additional land in the coastal strip has come under direct pressure from the expansion of human settlements since 1980, but it does not show extension of land subjected to pressure from other human uses, such as agriculture, road building or other infrastructure.
The analysis includes all urban development greater than 20 metres wide. It does not distinguish between development that is 20 metres wide and a hundred kilometers wide, and therefore does not recognise the wide range of impacts arising from these different scales of habitat removal.
Consequently, it omits development such as roads. Roads, without assistance from other elements of development, can fragment habitat with quite serious impacts on biodiversity, especially in densely inhabited habitat, impoverished or compromised habitat, or where roads are particularly busy.
Issues for which this is an indicator and why
Coasts and Oceans — Direct pressure of human activities on coasts and oceans - Direct pressure of coastal activities (other than shipping and fishing)
Urban development involves the total removal of biodiversity habitat for a wide range of species. It also fragments the habitat which remains. In the case of the biodiversity rich coastal regions of Australia, both the removal and the fragmentation of habitat will affect a very wide range of species and ecosystems. While the many impacts on diverse species and complex ecosystems resulting from changes to coastal land for human activities are difficult to measure, the extent of land under direct pressure from these changes is measurable and changes in that extent give an indication of the rate at which the pressure is increasing.
Other indicators for this issue:
- CO-27 Number, frequency, extent and volume of oil spills from all sources
- CO-28 Quantity of discharges of different substances from humans activities to coastal and marine waters
- CO-29 Change in area of coastal potential acid sulphate soils under development for human use
- CO-32 Number of injuries to marine animals from marine debris
- CO-44 Marine chlorophyll concentration
- CO-46 Comparative water quality of coastal lakes and lagoons (water quality gradient from north to south)
- CO-53 Evidence or examples of noise or visual disturbance of marine species by human activities
- CO-60 Sea salinity
- CO-65 Correlation between various human activities and introduction of coastal and marine species
- IW-12 Catchment nitrogen and phosphorus load
- HS-05 Total population and distribution
- IW-19 Exceedance of total nitrogen and phosphorus water quality triggers
- LD-40 Current research into pressures and contributions of naturalised introduced species
- BD-09 The change in extent of selected nationally significant invasive species
- BD-10 Examples of native species whose populations have declined where various invasive species have established resident populations
Biodiversity — Pressures on biodiversity - Pressures on marine biodiversity: pressures of coastal activities
Since human settlements tend to displace coastal biodiversity in its entirety while placing considerable pressure on estuarine and coastal waters, extension of human settlements along Australia’s coastline is an indicator for this pressure on biodiversity.
Other indicators for this issue:
- CO-27 Number, frequency, extent and volume of oil spills from all sources
- CO-28 Quantity of discharges of different substances from humans activities to coastal and marine waters
- CO-29 Change in area of coastal potential acid sulphate soils under development for human use
- CO-32 Number of injuries to marine animals from marine debris
- CO-44 Marine chlorophyll concentration
- CO-46 Comparative water quality of coastal lakes and lagoons (water quality gradient from north to south)
- CO-53 Evidence or examples of noise or visual disturbance of marine species by human activities
- CO-60 Sea salinity
- CO-65 Correlation between various human activities and introduction of coastal and marine species
- IW-12 Catchment nitrogen and phosphorus load
- IW-19 Exceedance of total nitrogen and phosphorus water quality triggers
- HS-05 Total population and distribution
Human Settlements — Pressures created by human settlements on the environment - Urban form
The impact of human settlements on coastal habitats and ecosystems depends considerably on the form of that urban development.
Other indicators for this issue:
Further Information
Source: Houston P 2005, Re-valuing the fringe: some findings on the value of agricultural production in Australia's peri-urban regions.
Source: Department of Sustainability and Environment, Melbourne 2030: Protecting Our Liveability Now and for the Future, Department of Sustainability and Environment, Melbourne.
Key
Links to another web site
Links to data in the DRS
Opens a pop-up window
PDF files
Adobe Acrobat Reader is required to view PDF files.
If you are unable to access a PDF file, please contact us to organise a suitable alternative format.