EMBARGOED UNTIL RELEASE AT 8:30 A.M. EDT, TUESDAY, JUNE 5, 2012
| Technical: Clifford Woodruff | (202) | 606–9234 | ||
| Technical: Catherine Wang | (202) | 606–9670 | ||
| Media: Ralph Stewart | (202) | 606–2649 | BEA 12—22 | |
| E–mail inquiries: | gdpbystate@bea.gov | |||
Advance 2011 and Revised 1997—2010 GDP–by–State Statistics
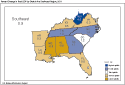
Real gross domestic product (GDP) increased in 43 states and the District of Columbia in 2011, according to new statistics released today by the U.S. Bureau of Economic Analysis (BEA) that breakdown GDP by state.1 Durable–goods manufacturing, professional, scientific, and technical services, and information services were the leading contributors to real U.S. economic growth. U.S. real GDP by state grew 1.5 percent in 2011 after a 3.1 percent increase in 2010.2

Real GDP increased in all eight BEA regions in 2011, although growth slowed in most regions. The Far West (2.1 percent) was the only region where growth accelerated. The Southwest region grew the fastest (2.7 percent), led by Texas with a 3.3 percent increase.

Durable–goods manufacturing was the largest contributor to U.S. real GDP by state growth in 2011. This industry increased 7.9 percent in 2011, after increasing 17.0 percent in 2010. It was the leading contributor to real GDP growth in six of the eight BEA regions and in 26 states. Durable–goods manufacturing contributed 3.94 percentage points to growth in Oregon and 1.17 percentage points to growth in Michigan.
Professional, scientific, and technical services and information services were also leading contributors to U.S. real GDP by state growth. Professional, scientific, and technical services increased 4.9 percent in 2011, matching its 2010 growth rate. This industry contributed to growth in all eight BEA regions and in every state, and was the leading contributor in the District of Columbia, Virginia, Massachusetts, New York, Maryland, New Jersey, Florida, and Arkansas.
Information services, which includes publishing and telecommunications, accelerated in 2011, increasing 5.1 percent after increasing 3.0 percent in 2010. This industry contributed to real GDP growth in 42 states and the District of Columbia. It was the largest contributor to real GDP growth in Colorado and Utah.
Even though mining was not a major contributor to real GDP growth for the nation, it was a large contributor in several states. In North Dakota, the fastest growing state in 2011, mining contributed 2.81 percentage points to real GDP growth of 7.6 percent.
In contrast, several industries subtracted from real GDP growth in 2011. Real estate, rental, and leasing subtracted the most. This industry subtracted from real GDP growth in all eight BEA regions and in 40 states.
Per capita real GDP by state in 2011. Per capita real GDP ranged from a high of $63,159 in Delaware to a low of $28,293 in Mississippi. Per capita real GDP for the U.S. was $42,070.
Revisions. For 2008—2010, the annual revisions to percent change were modest. For 2010, only in the states of Louisiana, Oregon, and New Hampshire was the absolute change three percentage points or larger. The advance estimates for 2010, released in June 2011, correctly indicated the direction of change for 48 states and the District of Columbia and also correctly identified whether a state grew at a faster or slower pace than U.S. GDP growth for 39 states. For 2009, only Wyoming, Michigan, and Connecticut had revisions of three percentage points or larger in absolute terms. For 2008, no states had revisions larger than three percentage points in absolute terms. For 1997—2007, revisions were small.
The GDP–by–state statistics for 2008—2010 incorporate new and revised data from the U.S. Census Bureau, specifically, new Annual Survey of Manufactures (ASM) data for 2010 and revised ASM for 2009, new State and Local Government Finances data for 2009, and new State Government Finances data for 2010. This "flexible" annual revision of GDP by state includes revised statistics for 1997—2007, for more information see the box "Summary of Improvements to Gross Domestic Product by State" on the next page.
Tables 1–4 show these results in more detail; complete detail is available on BEA's Web site at www.bea.gov.
The next release of GDP by state is scheduled for June 2013. This release will include revised statistics for 2009—2011 and advance statistics for 2012.
Summary of Improvements to Gross Domestic Product by State
The statistics released today reflect the results of the "flexible" annual revision of gross domestic product (GDP) by state for 1997—2010. This revision incorporates improvements in source data and statistical methods to more accurately portray state economies. The improvements did not meaningfully alter the overall picture of state economies over the period of 1997—2010. Major improvements introduced with this revision include:
- Improved estimation method for allocating profits across states in the air transportation industry.
- Improved estimation method for allocating gross operating surplus across states in the management of companies and enterprises industry.
- Incorporating wholesale trade margin price indexes from the Bureau of Labor Statistics (BLS), which replace sales–based price indexes used to deflate wholesale trade margin output for the years 2008 forward.
- Introducing Medical Expenditure Panel Survey (MEPS) and private trade source data to replace the benefits–to–premiums ratio based on the 2002 Economic Census data. These data were incorporated for all revision years beginning in 2004.
- Incorporating the Annual Retail Trade Survey and the Service Annual Survey, which have been benchmarked to the 2007 Economic Census, back to 2003.
- Incorporating improved quality–adjusted price indexes from the Federal Reserve Board�s Industrial Production Index program for communications equipment, for 2003 forward, to replace indexes based on the BLS Producer Price Index and import price indexes.
In addition, a methodological improvement was incorporated in the advance estimates for 2011 to improve the stability of statistics for the oil and gas extraction industry.
More information on the improvements and related revisions to GDP by state will be available in the July 2012 issue of the Survey of Current Business.
For additional information on the reasoning, impact, and scope of the flexible annual revision please refer to the briefing "Improving BEA's Accounts Through Flexible Annual Revisions" in the June 2008 issue of the Survey of Current Business at: http://www.bea.gov/scb/toc/0608cont.htm.
Advance Statistics of GDP by State for 2011 by NAICS Sector
The advance statistics of GDP by state for 2011 are based on a more limited set of source data and an abbreviated estimation methodology compared with the standard set of data and the estimation methodology used to prepare the revised NAICS statistics for 1997—2010. The advance GDP–by–state statistics are based primarily on earnings by industry data from BEA's regional economic accounts, released March 28, 2012, and on advance GDP–by–industry data from BEA's annual industry accounts, released April 26, 2012. Preliminary farm sector cash receipts data from the U.S. Department of Agriculture are incorporated in the agriculture, forestry, fishing, and hunting sector. Preliminary value of production and price data from the U.S. Department of the Interior and the U.S. Department of Energy are incorporated in the mining sector.
More information on the methodology used to produce the advance 2011 statistics, on the revised GDP–by–state statistics for 1997—2010, and on revisions to the GDP–by–state statistics will appear in an article in the July 2012 issue of the Survey of Current Business, BEA's monthly journal.
Explanatory Notes
Definitions. GDP by state is the state counterpart of the Nation's gross domestic product (GDP), the Bureau's featured and most comprehensive measure of U.S. economic activity. GDP by state is derived as the sum of the GDP originating in all the industries in a state.
The statistics of real GDP by state are prepared in chained (2005) dollars. Real GDP by state is an inflation–adjusted measure of each state's gross product that is based on national prices for the goods and services produced within that state. The statistics of real GDP by state and of quantity indexes with a base year of 2005 were derived by applying national chain–type price indexes to the current–dollar GDP–by–state values for the 64 detailed NAICS–based industries for 1997 forward and for the 63 detailed SIC–based industries for 1977—1997.
The chain–type index formula that is used in the national accounts is then used to calculate the values of total real GDP by state and of real GDP by state at more aggregated industry levels. Real GDP by state may reflect a substantial volume of output that is sold to other states and countries. To the extent that a state's output is produced and sold in national markets at relatively uniform prices (or sold locally at national prices), real GDP by state captures the differences across states that reflect the relative differences in the mix of goods and services that the states produce. However, real GDP by state does not capture geographic differences in the prices of goods and services that are produced and sold locally.
Relation of GDP by state to U.S. Gross Domestic Product (GDP). An industry's GDP by state, or its value added, in practice, is calculated as the sum of incomes earned by labor and capital and the costs incurred in the production of goods and services. That is, it includes the wages and salaries that workers earn, the income earned by individual or joint entrepreneurs as well as by corporations, and business taxes such as sales, property, and Federal excise taxes—that count as a business expense.
GDP is calculated as the sum of what consumers, businesses, and government spend on final goods and services, plus investment and net foreign trade. In theory, incomes earned should equal what is spent, but due to different data sources, income earned, usually referred to as gross domestic income (GDI), does not always equal what is spent (GDP). The difference is referred to as the "statistical discrepancy."
Starting with the 2004 comprehensive revision, BEA's annual industry accounts and its GDP–by–state accounts allocate the statistical discrepancy across all private–sector industries. Therefore, the GDP–by–state statistics are now conceptually more similar to the GDP statistics in the national accounts than they had been in the past.
U.S. real GDP by state for the advance year, 2011, may differ from the Annual Industry Accounts' GDP by industry and, hence NIPA (National Income and Product Account) GDP, because of different sources and vintages of data used to estimate GDP by state and NIPA GDP. For the revised years of 1997—2010, U.S. GDP by state is nearly identical to GDP by industry except for small differences resulting from the GDP–by–state accounts' exclusion of overseas Federal military and civilian activity (because it cannot be attributed to a particular state). The GDP–by–industry statistics are identical to those from the 2011 annual revision of the NIPAs, released in July 2011. However, because of revisions since July 2011, GDP in the NIPAs may differ from U.S. GDP by state.
BEA's national, international, regional, and industry statistics; the Survey of Current Business; and BEA news releases are available without charge on BEA's Web site at www.bea.gov. By visiting the site, you can also subscribe to receive free e–mail summaries of BEA releases and announcements.
1. Real GDP by state is an inflation–adjusted measure of each state's production, wherever sold. For a further description, see the "Explanatory Notes" section in this release.
2. For an explanation of the small difference between real GDP by state and real GDP in the national income and product accounts (NIPAs), see the section "Relation of GDP by state to U.S. Gross Domestic Product."
Last updated: Tuesday, June 5, 2012