Reflections on a surreal superstorm and the 2012 hurricane season

The Atlantic hurricane season officially ended a few days ago (while the atmosphere was trying but not succeeding in an attempt to produce a 20th storm, Valerie). Of course what it will be most remembered for, for generations to come, was Sandy, and that’s what most of this long entry will focus on; first, here are some thoughts on other notable aspects and takeaways of the season.
-- How many storms develop matters for some people (including forecasters such as me!), businesses and the government/military, and the effort to understand the meteorological and climate factors that go into determining the outcome of a season is a worthwhile one and excellent scientific work has been done in that regard. Yet, as I have been saying for years, 2012 reinforced again, and in fact more than ever, the utter uselessness of seasonal forecasts for public preparedness, with the ability to predict critical details of individual storms months in advance being beyond the state of the science. And this year, even forecasts for the total number of storms lacked accuracy.
-- In regard to the total numbers, an oddity is that a very high total number (19) of storms developed, but there was only one Category 3+, a curiously high ratio. Some of that dichotomy between total number of storms and high-end hurricanes might be due to technological advances and subjective human assessments which result in more systems of only tropical storm intensity getting designated as such than in the pre-satellite era or even a couple decades ago, but on the opposite end, analyses indicate that atmospheric instability was below average over the tropical Atlantic throughout the season, and tropical storms and Category 1-2 hurricanes trying to intensify seemed to often be fighting dry air.
-- Interestingly, while one of the U.S. hits occurred right during the peak-season [not-so-]sweet spot (Isaac in late August), there was exceptional early development (two named storms before the official start of the season), and the biggest event occurred late in the season and was an ultimate hybrid (characteristics of tropical, subtropical, and extratropical cyclones).
-- This was a season, whether or not Sandy was a hurricane at landfall, which reinforced that a tropical cyclone doesn’t have to be of hurricane intensity wind-wise to produce severe effects. Debby was only a tropical storm and nevertheless produced major flooding in Florida. Speaking of which, there must be a better way than the current one of referring to Category 3+ hurricanes. Officially they are called "major" ones, but tropical cyclones can be less than a Category 3 hurricane and have very major impacts, as evidenced by Sandy, Isaac and Debby this year, and Ike and Allison and many others in previous years. (Just like another "m" word -- the official term of a "moderate" risk of severe thunderstorms -- can be misleading.)
-- Similarly, this was a season which reinforced yet again that with tropical cyclones, size matters: Sandy & Isaac (large) vs. Beryl (tiny). Everyone recognizes the limitations of the Saffir-Simpson Scale, and while "IKE" (Integrated Kinetic Energy) incorporates the size element, it has its own complexities and challenges from a public communication standpoint. There’s got to be a way to crack this nut.
-- Related to that, this was a season of people not evacuating in time in advance of storm surge flooding, in communities in Louisiana such as Braithwaite (Isaac) and along the coast of New Jersey and New York (Sandy). That issue has been around for as long as there have been landfalling tropical cyclones, and even in this modern meteorological/technological/communication age, it still exists.
-- In looking at the average atmospheric circulation pattern aloft from May through October (map below), there are some things which stand out. The blue shades, representative of low pressure (troughs), fits well with there having been landfalls in Louisiana, Florida (two storms) and New Jersey, while there was another cluster of tracks way out toward the Azores. What jumps out the most, though, is that big red/orange spot over southern Greenland. The technical term for it is a large positive 500 millibar height anomaly, in other words higher-than-average pressure aloft, and analyses of individual months during that May-October period show that this signal was recurrent over/near that location (in fact going back to April), culminating in the über blocking ridge of high pressure there at the time of Sandy.

Image credit: NOAA Earth System Research Laboratory
A PERFECT STORM ... METEOROLOGICALLY AND OTHERWISE
When I was a young weather-obsessed boy growing up in New Jersey and frequently going "down the shore" as we say in NJ, I’d look up at the sky and wonder what it would be like when The Big One came.
Now I know.
Everything with Sandy came together perfectly. In a bad way, like the 1991 Perfect Storm, but in an even more -- much more -- extraordinary way both meteorologically and with the severity and scope of impacts on land. And it was a perfect storm of ingredients in more ways than just weatherwise. If a script writer came up with a storyline like this, maybe it’d win an Academy Award, although it might be viewed as being too much of a Hollywood fantasy. You can’t make this stuff up. This really happened. Truth really can be stranger than fiction.
Sandy had elements which were a tremendous success forecast-wise, starting with a remarkable prediction made eight days in advance by the ECMWF model. It cannot, though, overall be considered a fabulous success for the "weather enterprise" given the communication and procedural fiascos involved and the tragic loss of more than 130 people, the highest death toll in the northeast U.S. from a tropical cyclone in 57 years.
In the meteorological script, tropical and non-tropical forces, rather than as is typically the case competing with each other or at best balancing each other out, came together in a way to wickedly reinforce each other and make the end result even worse.
This analysis below shows the storm and its "warm core" (temperatures in the atmospheric column in the center of circulation higher than those surrounding it, characteristic of tropical cyclones) just offshore of New Jersey perfectly nestled between two "coupled jets" and their left front & right rear quadrants, known as "left exit and right entrance" regions (a configuration usually associated with non-tropical cyclones), which are conducive to air motions that are diverging in upper levels and rising from below along with low surface pressures. [The northern jet was blowing in an atypical direction, which for a while caused my eyes and brain to invert it into representing another left exit region over the storm; thanks to Jon Nese for pointing out that it's actually a right entrance there!]

Image credit: Plymouth State University
Sadly Sandy had it all: quick intensification over the Caribbean to nearly Category 3 strength, and devastation and tragedy there; then it became the Atlantic hurricane with the largest diameter of tropical storm force winds on record, nearly 1000 miles, while turning into essentially a hurricane within a nor'easter; it took an unheard-of track toward an extremely populated area; and, in its final stage, the record-setting late-season tropical system begat a record-setting early-season snowstorm.
Mel Shapiro is one of the world's leading experts on cyclones.
Bob Henson of NCAR/UCAR, in an article about the hybrid superstorm, writes, "I asked Shapiro how often he’s seen a storm like Sandy. He replied, 'Never.'"
And then there was the other stuff.
A controversial decision was made by the National Weather Service to not issue hurricane watches or warnings for a large, powerful hurricane expected to head directly toward and hit square-on one of the most highly populated areas on the planet, the reason given being that at the last minute before landfall it'd become a "post-tropical" cyclone. They then took the inconceivable (but it actually happened!) step of issuing a 1 1/2 page statement trying to explain and justify the decision.
In what appeared to be more than just a coincidence, the mayor of the Big Apple said on Saturday evening, October 27, ~48 hours before landfall, "Let me tell you first we are not ordering any evacuations as of this time for any parts of the city. We’re making that decision based on the nature of the storm. Although we’re expecting a large surge of water, it is not expected to be a tropical storm or hurricane-type surge. With this storm, we’ll likely see a slow pileup of water rather than a sudden surge, which is what you would expect with a hurricane, and which we saw with Irene 14 months ago."
I couldn’t believe my ears.
When I was that young boy in the NJ suburbs of NYC there was a snowstorm in 1969 that became known as "The Lindsay Storm" after that mayor was perceived to have not handled the city's response to the storm well. Now a mayor of one of the biggest cities of the world was misrepresenting the threat posed by a colossal hurricane.
Here is an elaboration upon what I said on camera in a recent TWC video piece about the lack of hurricane watches and warnings being issued.
1. From a communication standpoint, every word matters. In general, walking the line should be strived for between neither overplaying nor underplaying the seriousness of an upcoming weather situation, its expected impacts, and the probability thereof.
"Hurricane warning" (or watch) has an aura to it that the other warnings, such as high wind or coastal flood warnings issued for Sandy, do not, just as "tornado warning" has an inherently different tone to it and is perceived and reacted to differently than a severe thunderstorm warning, even though in a given situation the thunderstorms are expected to be producing similar wind speeds, just twisting vs. straight-line.
I have thought that at times in the past, the issuance of hurricane warnings, and then sticking with them when it was clear hurricane conditions were not going to happen, has been overdone. But in this case, it was clear that winds, at least in gusts, solidly to hurricane force were going to hit land, and the waves/surge were going to even be in excess of what would typically be the case with a Category 1 hurricane, because of the size of the wind field. (There’s the age-old issue of gusts vs. sustained winds, but there have been times when a system was classified as a hurricane at landfall, and few if any sustained winds of hurricane force were measured on land.)
Bryan Norcross has written much more about the Sandy communication issues in his Wunderground blog.
2. Thus, a hurricane warning should have been issued unless the storm was going to undergo sufficient extratropical transition well before landfall such that "hurricane" warnings could not be meteorologically justified. However, models showed the cyclone being warm-core right up to and including landfall, and that’s what was observed. Whether it had truly become primarily non-tropical shortly before it made landfall is debatable; it had always possessed hybrid characteristics along with its warm core, and although at landfall the process of substantively transitioning to a mainly non-tropical cyclone was finally starting to get underway, it arguably hadn’t made sufficient progress yet.
3. Whether or not at the last minute it had lost enough tropical cyclone characteristics matters for insurance rules, and for debates about the technicality that the National Hurricane Center invoked in advance as justification for not issuing hurricane warnings, i.e. that it would no longer be a tropical cyclone. But ultimately that seems moot, as the NHC was calling it a hurricane right up until that last moment, and while it was still a hurricane, wind gusts well above the hurricane force threshold of 74 mph were occurring on land along with serious coastal surge flooding and record tide levels. Sandy was not declared post-tropical until 7pm EDT on the 29th and gusts as high as 90 mph were measured (in Islip) a half-hour prior, and an hour before that the water level at Sandy Hook had already exceeded that of Hurricane Donna and the December 1992 nor'easter.
[UPDATE: As I'm posting this, news is breaking that the National Hurricane Center is proposing changes to their policy as a result of these issues with Sandy. Even with that, though, there was another communication snafu!]
Meanwhile, as New Jersey was reeling from the storm, the governor and a mayor of a coastal city were publicly accusing each other.
And all of this was going on a week before a presidential election.
Then after the storm it got even better (worse). There was news that an official assessment would be commencing ... but then came word that it was being abruptly halted. Exactly what the reason was for that and the extent to which it was valid and reasonable is still being hotly discussed, and there are new plans for an assessment, but regardless that cessation looked bad, raised eyebrows, and decreased trust.
THAT PLANE’S DUSTING CROPS WHERE THERE AIN’T NO CROPS
Prior to the storm making landfall, yours truly even suddenly found himself becoming part of the Sandy script. I’ve had viruses such as a respiratory one I was fighting around the time of the storm, but this time experienced a different kind. I thought that if someday I electronically had my Viral Moment (at least the first if not only one), it’d be because of something I’d written or said about global warming. (More on that topic in a moment...) Turned out it was when I posted a trosum (tropical summary) on Sunday the 28th, the day before landfall, on weather.com and here as a Wunderblog entry, which went viral after a TWC tweet urged people to "please read/retweet this strongly-worded statement from our senior meteorologist." And that they did, it being retweeted more than 3,000 times, which then led to a gazillion web articles and blogs. This one was particularly entertaining, as was this one with its snide remark at the end.
What put me over the edge was a set of ominous signs that were not only confirming what the computer forecast models had been predicting, if anything the storm was already overachieving on expectations that were inordinately high. And it wasn’t just that, it was the nature of what was happening. Like in Alfred Hitchcock’s North By Northwest, when the guy says to Cary Grant, "That plane’s dusting crops where there ain’t no crops," this storm was doing things that storms don’t usually do, both meteorologically and with effects produced.
On Saturday, October 27, two days before the center of circulation came ashore in New Jersey, significant coastal flooding was reported on the east coast of South Florida even though the core of the storm stayed offshore and was pulling farther away, and tide levels were not all that much above normal astronomical levels. The contribution by the full moon didn’t seem to fully explain it. In eastern North Carolina in the Wilmington area, trees were downed despite the center passing very far offshore.
Those things were directly and indirectly representative of Sandy’s circulation becoming ginormous. What’s more, by that afternoon, as can be seen in the image below, the circulation consisted of just a swirl of ragged, mainly shallow clouds virtually devoid of deep convection, yet the storm retained its central pressure at a very low 960 millibars along with a strong wind field. There weren’t any crops, yet the plane was dusting...

Image credit: UW-Madison SSEC/CIMSS
Then in yet another ominous sign, and reminiscent of Hurricane Ike in Texas, coastal flooding such as this in Wildwood was already occurring in New Jersey on Sunday the 28th, long before the main direct surge of water and onshore winds occurred. This was going to be a multiple-high-tide event, and by the time of the morning one on the day of destiny, Monday, October 29, 2012, water levels were even higher and the flooding getting more serious on the Jersey Shore with still 12 hours to go before landfall of the center and the primary storm surge, and with winds that morning blowing offshore! That Sandy plane was again dusting where there ain’t no crops. A little extra water height from tides elevated by the full moon contributed, but the primary culprit was the size of the storm.
Then the main event came during the afternoon and evening in the northeast U.S., with both a strong surface pressure gradient and an even more intense core of wind just above the surface, some of that being able to transfer down and produce 70-90 mph gusts. Many millions of people lost power, and countless trees came down.
Although the high astronomical tide that evening was a little lower than the ones before and after it (thus one must be careful to not overstate the role of the full moon in the outcome), the strongest onshore winds and the peak storm surge in New York City coincided with the time of high astronomical tide, the worst possible timing.

Water level at The Battery in New York City. Blue = astronomical tide levels; red = the actual observed level; green = the difference between the two, or the surge value. Image credit: NOAA/NOS/CO-OPS
That was a factor in the storm tide (astronomical tide + surge) water levels which set records in places such as The Battery in Lower Manhattan and Sandy Hook, N.J., adding extra zing to the main ingredient in the recipe for catastrophe: an extraordinary hybrid cyclone -- a hurricane within a nor’easter -- with a central pressure of 940 millibars as it headed toward the coast and not rising much before landfall (exceptionally low for that area and representative of the storm’s overall power), taking a track unprecedented in the known historical record, with the center of circulation moving perpendicularly into the New Jersey coast and a lethally large area of sustained tropical storm force winds and hurricane force gusts blasting directly onshore.
After Sandy was no longer officially designated "Hurricane Sandy," The Weather Channel commenced referring to it as "Superstorm Sandy." That name was all over the media, social and otherwise, long before TWC started using it. It did not originate with us, and meteorologists including me were involved in the decision to adopt it. Initially I was resistant, given the sacred ground that the March 1993 Superstorm occupies in the annals of weather history, but came to the conclusion that Sandy's meteorological attributes and the scope of its impacts were sufficient to justify the use of the term again for the second time in the modern era of meteorology. There was an event in 1950 – the "Appalachian Storm" in November of that year – that would probably also merit such a moniker.
SANDY AND GLOBAL WARMING
Sandy appears to have been a game-changer for the conversation about the topic of "anthropogenic global warming" (AGW).
In the wake of the storm the reaction has been intense, most notably stoked by this:

Image credit: Bloomberg Businessweek
In an on-camera TWC video segment, I said, "In the wake of Sandy, there have been two opposite, extreme reactions: either, 'Of course global warming caused it,' or, 'That’s balderdash!' What we need to do take a step back, take a deep breath, and objectively assess what role if any global warming may have played. When we do that, given the storm's track and meteorological nature, its context amongst other extreme events and patterns in recent years, and what one would expect to see in a warmed climate system and the physical processes involved, a reasonable initial conclusion is that global warming -- the changing climate -- did contribute to the outcome."
How?
It seems there are four potential ways, with varying levels of confidence/likelihood which I've suggested:
Sea level: Definitely
It has been analyzed to have risen approximately a foot in the past century along the New Jersey and New York coasts. On the one hand, Sandy’s storm tide and coastal flooding would have been extreme even without this. On the other hand, the rise did make the water level higher and contributed to the outcome.
Water temperatures: Possibly
Sea surface temperatures (SSTS) were running well above average all along Sandy’s path from the Caribbean to the north, and exceptionally so in the Gulf stream offshore of the Mid-Atlantic and Northeast coasts, an area representing a critical time in Sandy’s track. How warm the water is at the surface and below can be overrated as a factor in tropical cyclone intensity, as what’s going on in the atmosphere is what’s most important, but everything else being equal, water which is much warmer than average is more favorable to increasing or maintaining strength than water which is much cooler than average. The question with Sandy is whether it made a difference and if so to what extent, and to what extent this regional anomaly was related to the overall global trend of warming ocean water.
Storm strength/size: Possibly
The jury is still out on how global warming is and/or will be affecting tropical cyclones. Latest research suggests perhaps a future increase in intensity, not frequency, but assessing a relationship between changes in climate and hurricanes is more complex and difficult than, say, identifying a connection with changes in extreme temperatures.
Climate change research also suggests an increase in precipitation extremes (both dry and wet), via increased evaporation.
While one wonders what might have been if the hurricane which almost reached Category 3 strength while in the Caribbean hadn’t been disrupted so much while crossing Cuba, Sandy’s winds while over the Atlantic weren’t particularly extreme; and, though Sandy produced heavy rain in some areas and the remarkable snowstorm in the Appalachians, the storm's total precipitation wasn't particularly extreme by tropical cyclone standards.
The humongous size and bizarrely perfect hybrid hurricane-within-a-nor’easter structure were among the aspects of Sandy which were extraordinary. For now it's not clear exactly what the physical connection would be between a warmer atmosphere and larger and/or hybrid storms, though there could be one and further study is merited.
Dr. Masters posted a blog entry focusing on this question and came to a similar conclusion; but aside from Sandy, as he asked in an entry following Isaac, "What's the deal with these super-sized Category 1 and 2 hurricanes that have been hitting the U.S.?"
Track: Likely
Sandy's path heading northeast about halfway between North Carolina and Bermuda but then turning sharply left and making a perpendicular beeline to the New Jersey coast is unprecedented in the known historical record. That should beg the question, "What’s up with that? Did the fact that the climate is changing play a role?"
For that to be the case, a logical meteorological connection ought to be evident, and there is one.
Recent published research by Jennifer Francis and Stephen Vavrus identified specific connections between loss of Arctic sea ice (the minimum extent of which this year broke 2007's record low during the satellite era) and changes in general circulation patterns downstream including ridges of high pressure aloft.
And I’ve added Sandy to the >1000-slide compendium I’ve compiled of cases in recent years in which strong ridges of high pressure aloft have played a role in extreme temperatures, precipitation, and storms, in the context of an overall trend of rising pressures aloft (actually heights such as that of the 500 millibar level) not just over the Arctic but in the larger scale, in concurrence with rising temperatures.

Image credit: Wright-Weather.com
Not only was the "blocking" ridge centered over southern Greenland exceptionally strong (map above) at the time of the storm, which in combination with an insanely "negatively-tilted" trough over the central-eastern United States forced Sandy to take that path, it occurred in the context of this:
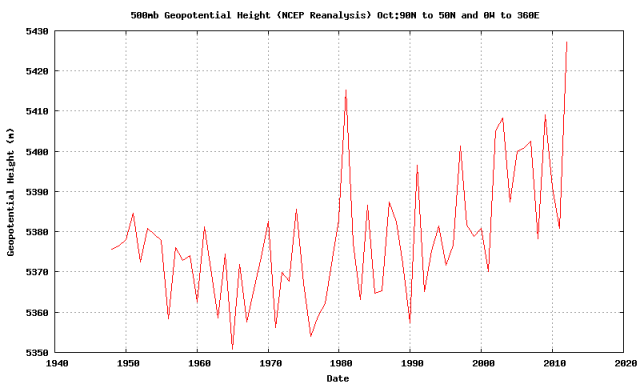
That graph courtesy of NOAA’s Earth System Research Laboratory website is a plot of average 500 millibar heights in October at high latitudes (50°N to the pole). There is both an obvious upward trend since the 1970s and an extreme peak in October 2012, likely representing an influence of the warming climate upon the configuration of the atmosphere steering flow by "setting the table" and skewing the odds for if not outright causing Sandy’s unusual track, which led to the outcome.
WHATEVER IT WAS AND WHATEVER THE ROLE OF THE CHANGING CLIMATE
Whether a hurricane or a post-tropical cyclone at landfall, and regardless of global warming, Sandy was one for the ages, and reinforces how vulnerable we are to the forces of nature. This Joisey boy’s heart aches for, and my thoughts are with, those in my home state and everyone who was in the path of the storm.

Water vapor satellite image of Sandy the day after landfall. Image credit: NERC Satellite Receiving Station, Dundee University, Scotland
[This entry was updated on December 6 to add a couple images/sentences.]
Reader Comments
Page: 1 — Blog Index
The majority of New Yorkers who died in Hurricane Sandy drowned, many in their homes. A Wall Street Journal graphic details each death: Eden Toussaint, 58, drowned and was found in his basement in Queens; Rick Gold, 67, drowned and was found in his basement, also in Queens; Walter Colborne, 89, drowned after fleeing his Staten Island home.
There are similarly heart-breaking deaths in New Jersey's coastal towns.
All of them point to the need for warnings about storm surge that are understandable and convey the danger that floodwaters pose, even in a storm without fierce winds.
Three years after it dropped surge from the numerical categories used for hurricanes, the National Hurricane Center is inching closer to a separate warning for floodwaters as part of a storm system. It is urgently needed. Center officials say that the full warning system won't be ready until 2015, but they should look for any way possible to speed up that time line.
In the meantime, a color-coded map that indicates how much water is expected in different areas along the coast needs to be ready for use during the 2013 hurricane season. But Hurricane Center officials are not committing to that. They say the map may be ready next year or in 2014.
Another hurricane season is really too long for vulnerable communities to wait. The maps ought to be available for the 2013 season, and Congress should give the Hurricane Center the resources to make that possible.
The Storm Surge Unit is small, which is a result of budget limitations, team leader Jamie Rhome told Times-Picayune/NOLA.com reporter Mark Schleifstein during a Dec. 5 tour of the center at Florida International University. "I'm the only federal employee here dedicated to storm surge. One federal employee to do what we do in a hurricane, to do all the outreach and training in the offseason and to try to help on the international front.''
Mr. Rhome's staff includes a representative from NOAA's science corps, which is not part of the National Weather Service, and three private contractors. But that is a tiny group to handle surge forecasting during hurricane season -- sometimes on more than one storm at once -- and work on surge research and storm analysis in the other months.
Access to technology for the research has been an issue as well. The surge maps will be based on high-resolution topography information. That is now in hand, but the surge team is trying to decrease the time it takes to create a surge map as a storm is moving toward the coast.
Officials need to agree on the final map and then figure out how best to distribute it to local forecast offices and emergency management agencies. That will take significant coordination and training all along the nation's coastlines.
Obviously, that is a very complicated process. But there must be a sense of urgency about getting it completed for 2013. Hurricane Center officials should figure out what it will take to do so, and then Congress should provide the necessary funding.
The maps, although they will lack the precision of the surge warning being developed, are easily understandable. Blue indicates 3 feet or less water above ground level and red is at the extreme upper end, 9 feet or more above ground. Yellow and orange are intermediate depths. When done, the full warning system will let people know where life-threatening flooding is likely. But the colors on the maps make it pretty obvious if you are at risk.
The heightened awareness of storm surge started with Katrina. And this fall, Isaac and Sandy provided grim reminders. Both of them had only Category 1 winds, but they had dangerous levels of surge that coastal residents didn't fully understand.
There is detailed information on surge available during a storm, but it is not disseminated in an understandable and useful way. It hasn't been emphasized to the public as it should be, either. In addition, local officials have been left to decipher technical information they may not be equipped to handle.
National Hurricane Center directors and emergency managers in hurricane-prone states have complained for 20 years about leaving those decisions to local officials who are untrained and may be more concerned about issues like the cost of evacuation. As the surge warnings are developed, state and local officials who are making evacuation decisions need to be trained to decipher the information.
The impetus is obvious: A clear warning could save lives.
Ann George, 60, and Augustus "Gus" Saunders, 52, drowned in their Braithwaite home during Isaac. The couple believed they could weather the storm. Dozens of other residents there and in LaPlace thought the same thing and ended up being rescued from the floodwaters.
They and Sandy's victims in the Northeast are why the new warning system is so important and why the surge maps, at the least, need to be ready for next season.
Excellent review Stu.
.."calamity knows NO border's, only men's minds and maps do"...
~Maddy
How about Hurricane force winds .. record coastal flooding .. storm surge. extremely heavy rainfall .. prepare to evacuate and most of all extremely dangerous scenario . All of these are part of the briefings and warnings issued by the NWS several days prior to landfall.
To me, as a layperson, extremely dangerous conveys a warning far more meaningful than hurricane. Indeed, I found these far more meaningful than the warnings for Hurricane Irene last year.
I think an emergency manager would have to be blind, deaf and dumb not to realize that a very dangerous storm was approaching.
Viewing: 5 - 1
Page: 1 — Blog Index