June 08, 2017
When a bug for an intermittent test failure needs attention, who should be contacted? Who is responsible for fixing that bug? For as long as I have been at Mozilla, I have heard people ask variations of this question, and I have never heard a clear answer.
There are at least two problematic approaches that are sometimes suggested:
- The test author: Many test authors are no longer active contributors. Even if they are still active at Mozilla, they may not have modified the test or worked on the associated project for years. Also, making test authors responsible for their tests in perpetuity may dissuade many contributors from writing tests at all!
- The last person to modify the test: Many failing tests have been modified recently, so the last person to modify the test may be well-informed about the test and may be in the best position to fix it. But recent changes may be trivial and tangential to the test. And if the test hasn’t been modified recently, this option may revert to the test author, or someone else who isn’t actively working in the area or is no longer familiar with the code.
There are at least two seemingly viable approaches:
- “You broke it, you fix it”: The person who authored the changeset that initiated the intermittent test failure must fix the intermittent test failure, or back out their change.
- The module owner for the module associated with the test is responsible for the test and must find someone to fix the intermittent test failure, or disable the test.
Let’s have a closer look at these options.
The “you broke it, you fix it” model is appealing because it is a continuation of a principle we accept whenever we check in code: If your change immediately breaks tests or is otherwise obviously faulty, you expect to have your change backed out unless you can provide an immediate fix. If your change causes an intermittent failure, why should it be treated differently? The sheriffs might not immediately associate the intermittent failure with your change, but with time, most frequent intermittent failures can be traced back to the associated changeset, by repeating the test on a range of changesets. Once this relationship between changeset and failure is determined, the changeset needs to be fixed or backed out.
A problem with “you broke it, you fix it” is that it is sometimes difficult and/or time-consuming to find the changeset that started the intermittent. The less frequent the intermittent, the more tests need to be backfilled and repeated before a statistically significant number of test passes can be accepted as evidence that the test is passing reliably. That takes time, test resources, etc.
Sometimes, even when that changeset is identified, it’s hard to see a connection between the change and the failing test. Was the test always faulty, but just happened to pass until a patch modified the timing or memory layout or something like that? That’s a possibility that always comes to mind when the connection between changeset and failing test is less than obvious.
Finally, if the changeset author is not invested in the test, or not familiar with the importance of the test, they may be more inclined to simply skip the test or mark it as failing.
The “module owner” approach is appealing because it reinforces the Mozilla module owner system: Tests are just code, and the code belongs to a module with a responsible owner. Practically, ‘mach file-info bugzilla-component <test-path>’ can quickly determine the bugzilla component, and nearly all bugzilla components now have triage owners (who are hopefully approved by the module owner and knowledgeable about the module).
Module and triage owners ought to be more familiar with the failing test and the features under test than others, especially people who normally work on other modules. They may have a greater interest in properly fixing a test than someone who has only come to the test because their changeset triggered an intermittent failure.
Also, intermittent failures are often indicative of faulty tests: A “good” test passes when the feature under test is working, and it fails when the feature is broken. An intermittently failing test suggests the test is not reliable, so the test’s module owner should be ultimately responsible for improving the test. (But sometimes the feature under test is unreliable, or is made unreliable by a fault in another feature or module.)
A risk I see with the module owner approach is that it potentially shifts responsibility away from those who are introducing problems: If my patch is good enough to avoid immediate backout, any intermittent test failures I cause in other people’s modules is no longer my concern.
As part of the Stockwell project, :jmaher and I have been using a hybrid approach to find developers to work on frequent intermittent test failure bugs. We regularly triage, using tools like OrangeFactor to identify the most troublesome intermittent failures and then try to find someone to work on those bugs. I often use a procedure like this:
- Does hg history show the test was modified just before it started failing? Ping the author of the patch that updated the test.
- Can I retrigger the test a reasonable number of times to track down the changeset associated with the start of the failures? Ping the changeset author.
- Does hg history indicate significant recent changes to the test by one person? Ask that person if they will look at the test, since they are familiar with it.
- If all else fails, ping the triage owner.
This triage procedure has been a great learning experience for me, and I think it has helped move lots of bugs toward resolution sooner, reducing the number of intermittent failures we all need to deal with, but this doesn’t seem like a sustainable mode of operation. Retriggering to find the regression can be especially time consuming and is sometimes not successful. We sometimes have 50 or more frequent intermittent failure bugs to deal with, we have limited time for triage, and while we are bisecting, the test is failing.
I’d much prefer a simple way of determining an owner for problematic intermittents…but I wonder if that’s realistic. While I am frustrated by the times I’ve tracked down a regressing changeset only to find that the author feels they are not responsible, I have also been delighted to find changeset authors who seem to immediately see the problem with their patch. Test authors sometimes step up with genuine concern for “their” test. And triage owners sometimes know, for instance, that a feature is obsolete and the test should be disabled. So there seems to be some value in all these approaches to finding an owner for intermittent failures…and none of the options are perfect.
When a bug for an intermittent test failure needs attention, who should be contacted? Who is responsible for fixing that bug? Sorry, no clear answer here either! Do you have a better answer? Let me know!


June 08, 2017 04:17 AM
May 31, 2017
Project Tofino was an attempt by Mozilla to develop a new web
browser. I think Mark Mayo, Senior Vice President of Firefox, described Tofino best:
[W]e’re working on browser prototypes that look and feel almost nothing like the current
Firefox… [we’re trying to solve] the kinds of problems people have that aren’t currently solved
by anybody’s browser product.
My colleague Richard Newman and I were responsible for designing and implementing a data storage
layer to back Tofino. The engineering organizations I’ve been a part of and have witnessed at
Mozilla do not have a culture of lessons learned, final reports, and post-mortems. I’m a
context-building history-oriented learner so I’d like to change that, one little bit, by providing
my biased account of the forces that resulted in us proposing Mentat to meet Tofino’s data storage needs.
Data storage in Tofino
Richard and I have a lot of experience storing data for browsers (which I’ll return to), and Richard
captured some of his thinking about storage in a blog post. All told, we wanted storage that:
- could handle existing Firefox data like bookmarks, history, and passwords;
- was easy to evolve to handle new Tofino data like page thumbnails, fulltext web content indexes,
and A/B testing results;
- performed well on an under-powered Windows tablet (the kind you might buy at a big-box store).
However, we also carry the scars from implementing multiple Firefox Sync clients. For those not
intimately familiar with browsers and Firefox, Sync is a distributed system that co-ordinates
browser data (bookmarks, history, passwords, etc) across your devices (Desktop, Android, iOS). Sync
in general is a very hard problem and Firefox Sync is a poor rendition of a sync solution . Richard and I knew
that Tofino would eventually evolve to become a Firefox Sync client (or grow a similar Sync
solution). So we also wanted storage that:
- would support an eventual Firefox Sync client.
To meet Tofino’s needs we proposed and are prototyping Project Mentat, a data store designed for embedded client applications. The
initial blog post announcing Mentat (née Datomish)
does a great job framing the data problems Tofino and Firefox face and how we’re trying to solve
them. In a nutshell, Mentat:
- is designed to be embedded into client applications;
- manages a strong schema and helps you evolve that schema over time;
- separates readers from writers, allowing to optimize critical queries;
- maintains a historical log, supporting three-way merges when syncing.
How we got to Mentat
Ancient history [2011-2016]
Any good origin story starts before the beginning, so in that spirit, let us start with ancient
history that predates Tofino. For simplicity, I’ll refer to myself and Richard Newman as the team
. Our experience led us to to design a storage system supporting (and eventually integrated
with) the Firefox Sync implementation. We got here in stages:
- Firefox for Desktop is the cautionary tale: this is what happens when storage and syncing are not integrated;
- Firefox for Android is the second system that learned some architectural lessons but "didn’t go far
enough"; and
- Firefox for iOS gets it "mostly right".
To set the scene, Richard inherited Firefox Sync, the Firefox for Desktop implementation. The
initial development was done in an add-on ; it used observer notifications to witness
changes relevant to Sync and track those changes in memory to propagate upstream. The code landed
with this architecture and the foundational decision to rely on observer notifications resulted in
significant issues :
- not all data sources produced the notifications required for Sync;
- notifications were lost at start-up, shutdown, and when Sync itself had bugs;
- the notification flow is inherently non-transactional .
Richard and I wrote the Firefox for Android Sync implementation. Richard owned Sync
and, eventually, the Firefox for Android storage implementation. Sync was built as a stand-alone
process from day one, factored out of the browser front-end via the Android ContentProvider
storage abstraction . Unfortunately, we didn’t appreciate how significant
transactional syncing would be, and we made Firefox for Android’s data storage "live": the browser
and Sync update the store non-transactionally — potentially at the same time — leading to subtle UI
conflicts and missed changes in Sync .
Richard also owned the Firefox for iOS storage and Firefox Sync implementations. The two systems
were designed to support each other from day one. The storage system is:
- entirely transactional and robust in the face of extreme behaviours;
- well factored, enabling performance improvements to key user interactions due to the single point
of responsibility for data;
- significantly less likely to lose or corrupt Sync data than the other implementations.
These performance improvements are most notable in the iOS top sites implementation. Top sites is
the panel of most frecent sites shown every time the user taps the URL bar to navigate
somewhere new. The iOS top sites panel displays instantly, since the underlying store keeps a
materialized view (a read-only computed cache) in memory and updates it efficiently independent of
the user interface.
Enter Tofino [April 2016]
Tofino was pitched as an entirely new browser product. We anticipated a data footprint similar to
Firefox for iOS, so we started to express the architectural lessons we had learned from the two
previous storage implementations using web technologies . The team started to build an
Electron/Node.js desktop application. We quickly discovered (or perhaps, realized) that a
client/server architecture is the best model for our web technology implementation. We started to
develop a User Agent service: an always available backend that stored browsing data for the user and
leveraged that data to help the user exploit the web. We settled into a familiar pattern,
recognizable to anyone who has built a Web App:
- UI -> transport -> UA service
- UI updates locally (optimistic update)
- UA service -> transport -> notifies UI to update locally (authoritative update)
where the transport was variously HTTP requests, Web Socket messages, or Electron’s IPC.
Tofino almost immediately pivoted to product and user research. Suddenly there was much more
interest in capturing event streams, and an immediate need to support rapid prototyping. We started
to build a Node.js service, backed by SQLite, to store events, materialize views, and update and
publish changes to clients.
Tofino product evolution [September 2016]
We quickly observed that adding data to our hand-written SQLite store required migrating the SQLite
store forward rapidly. Each data type we wanted to add required a back-and-forth between the
product owner, the front-end team, and the storage team. In response, we started to investigate
event stores that might do this work for us. Unfortunately, most offerings were:
- not embeddable (targeted the Java Virtual Machine (JVM), or were intended to scale horizontally in
the cloud); or
- more general than we were comfortable with (graph stores like Neo4J generally don’t query for time
ranges efficiently; document stores like Mongo generally don’t support strong schemas); or
- not general enough (key-value stores like LMDB and LevelDB don’t support strong schemas and
high-level queries); or
- not mature enough to ship to a market of Firefox’s size (side-projects like Cayley).
Evaluating this technical landscape, Richard and I found the ideas behind Cognitect’s Datomic most compelling. Datomic:
- is assertion (event) oriented;
- maintains a full transaction log;
- exposes an expressive, extendable schema;
- models row-oriented (relational) data efficiently;
- is flexible enough to model graph-oriented data.
Sadly, Datomic targets the JVM and we don’t see a path to shipping 200+ Mb of VM and database to
Firefox’s market. (In addition, Datomic is not open-source, making it an awkward cultural fit for Mozilla.)
Concurrently, the product and front-end teams wanted to rapidly prototype using tools like GraphQL.
Our research into GraphQL suggested that performance would be poor and very difficult to address,
but we see Datomic’s query and transact syntax as enabling experimentation by the front-end team
similar in spirit (if not expression) to GraphQL, and also possible to make performant.
To research the ideas by Datomic, we started to adapt Nikita Prokopov’s awesome DataScript, a Clojure{Script} Datomic-alike that transpiles to
JavaScript and can run in the browser and in Node.js. DataScript is an in-memory store, not
suitable for Firefox-sized work loads, and fundamentally synchronous (which is a big problem in the
highly concurrent JavaScript browser environment).
Datomish [July 2016]
The work to make DataScript asynchronous, backed by a persistent store (a flat file, IndexedDB,
SQLite) was close to a rewrite, but we still felt that Datomic’s model was compelling for our
requirements — particularly our emphasis on experimentation and managing change. So we started to
build a Clojure{Script} Datomic-alike. This short-lived prototype was named Datomish. Datomish:
- re-used key pieces of DataScript’s source code;
- persisted to SQLite;
- translated Datomic’s Datalog queries to SQLite queries.
The main idea was to reduce the unknown performance of Datomic’s Datalog queries to the better known
performance of SQLite’s SQL queries. The Datomish prototype convinced us that the SQLite
translation could be done efficiently and yield performant queries against the working-sets we
expect to witness in Firefox in the wild. It was flexible in the ways we wanted, and early
experience suggested that the store was performant enough to back the Tofino browser and related
experiments. However, the Datomish prototype was not fit for greater purposes in three regards:
- the transpiled JavaScript could not be reasonably shipped in a product with Firefox’s audience;
- the ClojureScript prototype suffered from emergent memory leaks due to subtle bugs with our use of
ClojureScript’s persistent data structures and communicating sequential processes implementation,
and exposed impedance mismatches between JavaScript and ClojureScript; and
- we felt that ClojureScript and JavaScript were not the right technologies to back data storage for
Android or iOS.
The end of Tofino [December 2016]
At this point, the Tofino product experiment was stopped. None of the UX experiments and prototypes
were deemed worthy of future investment. The people working on Tofino joined the people working on
Datomish (me and Richard) to prototype a Datomic-alike written in Rust. We hoped to:
- ship in Firefox for Desktop;
- be able to ship on Android and iOS;
- improve on the performance and robustness of the Clojure{Script} implementation.
In response, the newly enlarged team rapidly stood up a Rust version of Datomish, which we named
Project Mentat.
Redirection [April 2017]
Throughout Q1 2016, we focused on implementing the core features of Project Mentat. However, senior
management redirected effort away from "ship in Firefox for Desktop" and toward two alternate goals:
- prototype the new Firefox UI (Photon), using lessons learned from the existing Firefox UI
(Australis) implementation expressed using React in Tofino;
- re-focus on Mentat as a component of new product experiences, in the same way that Tofino had
focused on new product experiences.
In response, we re-focused the people who had been working on Tofino onto the "Photino" Photon UI
prototype .
Crucially, we continued to build Mentat as a store that:
- focused on flexibility and schema evolution; and
- could meet performance requirements through suitable abstractions rather than manual tinkering; and
- would support a robust Sync solution (that was not necessarily Firefox Sync);
while additionally proposing an architectural split between the user interface, browser data, and
web rendering platform that we believe Mozilla should invest in across all its browser offerings.
Status [May 2017]
Where does the Project Mentat codebase stand? As of May 2017 we’ve implemented basic transacting:
- assertion and retraction with :db/add and :db/retract
- map notation like {:db/id ... :some/attribute :some/value ...}
- foundational data types like :db.type/long, :db.type/string, :db.type/keyword, etc
- cardinality constraints with :db.cardinality/one and :db.cardinality/many
- custom identifiers with :db/ident
- schema mutation equivalent to Datomic’s :db.install/attribute
- temporary identifier resolution like Datomic`s {:db/id "tempid"}
- :db.unique/identity and upserts
and basic querying:
- accepting a large subset of Datomic’s Datalog query language
- non-trivial joining with :or and :or-join
- negation with :not and :not-join
- interpolating input values with :in
- projecting scalar, vector, tuple, and relation results
- ordering and limiting result sets
- some non-trivial query pruning and type-aware optimization
The Rust implementation is not yet as full featured as the Clojure{Script} prototype:
- no support for aggregates like (count), (max), and (min) in queries;
- no fulltext search with :db/fulltext true attributes in queries;
- no schema registration and migration layer on top of the basic store;
- no transactor loop and transaction listeners.
But we think what is implemented is robust and has a clear path to production. We anticipate it
will take roughly 3 months to land Mentat into Firefox for Desktop and to back a simple store like
logins or form history using the new technology. The most significant work will be managing the
application life cycles and locking and concurrency; the foundational work for applying transactions
and querying the store is essentially complete.
Review [May 2017]
Mentat is currently running an architectural review gauntlet to decide whether Mozilla will invest
further or cancel the project. The architecture review has focused primarily on whether Mentat can
address the wide-ranging short-term storage architectural failings that hold Firefox for Desktop
down. Unfortunately, we didn’t expect to need to do so at this time — indeed, we were told not to!
— so we’re fighting to justify our approach as I type.
We still believe that Mentat can solve some of Firefox’s storage problems right now and can evolve
to solve most of the others, but we have not engaged directly with most of the concrete problems the
architecture review process foresee. I hope we’ll get time to do so, but if we don’t — this blog
post can serve as a Project Mentat pre-mortem.
Conclusion
I hope this narrative explains the forces that shaped the arc we followed to get to Mentat, and that
not all of the problems we faced, solutions we explored, and artifacts we created are lost immediately.
Thanks to Richard Newman (@rnewman) for being the animating force behind Mentat and this work.
Thanks to Joe Walker for being a great manager to work with and for. And thanks to Mark Mayo and
the Tofino team for trying a new thing, regardless of the outcome. Innovator’s dilemma is a real thing.
Many thanks to Joe Walker, who provided initial feedback on this blog post before it was intended
for public consumption; and to early readers and reviewers Richard Newman, Grisha Kruglov, Ralph
Giles, and Francois Marier, who provided valuable feedback and compelled me to expand or rewrite
many sections.
Discussion is best conducted on IRC: I’m nalexander in irc.mozilla.org/#mentat and on Slack
(Mozilla Corporation only), and I’m @ncalexander on Twitter.
Changes
- Wed 31 May 2017: Incorporated suggestions from Francois Marier.
- Mon 29 May 2017: Incorporated suggestions from Grisha Kruglov, Ralph Giles, and Richard Newman.
- Wed 24 May 2017: Initial version.
May 31, 2017 11:00 PM
May 27, 2017
Ever since the original iPhone came out, I’ve had several ideas about how they managed to achieve such fluidity with relatively mediocre hardware. I mean, it was good at the time, but Android still struggles on hardware that makes that look like a 486… It’s absolutely my fault that none of these have been implemented in any open-source framework I’m aware of, so instead of sitting on these ideas and trotting them out at the pub every few months as we reminisce over what could have been, I’m writing about them here. I’m hoping that either someone takes them and runs with them, or that they get thoroughly debunked and I’m made to look like an idiot. The third option is of course that they’re ignored, which I think would be a shame, but given I’ve not managed to get the opportunity to implement them over the last decade, that would hardly be surprising. I feel I should clarify that these aren’t all my ideas, but include a mix of observation of and conjecture about contemporary software. This somewhat follows on from the post I made 6 years ago(!) So let’s begin.
1. No main-thread UI
The UI should always be able to start drawing when necessary. As careful as you may be, it’s practically impossible to write software that will remain perfectly fluid when the UI can be blocked by arbitrary processing. This seems like an obvious one to me, but I suppose the problem is that legacy makes it very difficult to adopt this at a later date. That said, difficult but not impossible. All the major web browsers have adopted this policy, with caveats here and there. The trick is to switch from the idea of ‘painting’ to the idea of ‘assembling’ and then using a compositor to do the painting. Easier said than done of course, most frameworks include the ability to extend painting in a way that would make it impossible to switch to a different thread without breaking things. But as long as it’s possible to block UI, it will inevitably happen.
2. Contextually-aware compositor
This follows on from the first point; what’s the use of having non-blocking UI if it can’t respond? Input needs to be handled away from the main thread also, and the compositor (or whatever you want to call the thread that is handling painting) needs to have enough context available that the first response to user input doesn’t need to travel to the main thread. Things like hover states, active states, animations, pinch-to-zoom and scrolling all need to be initiated without interaction on the main thread. Of course, main thread interaction will likely eventually be required to update the view, but that initial response needs to be able to happen without it. This is another seemingly obvious one – how can you guarantee a response rate unless you have a thread dedicated to responding within that time? Most browsers are doing this, but not going far enough in my opinion. Scrolling and zooming are often catered for, but not hover/active states, or initialising animations (note; initialising animations. Once they’ve been initialised, they are indeed run on the compositor, usually).
3. Memory bandwidth budget
This is one of the less obvious ideas and something I’ve really wanted to have a go at implementing, but never had the opportunity. A problem I saw a lot while working on the platform for both Firefox for Android and FirefoxOS is that given the work-load of a web browser (which is not entirely dissimilar to the work-load of any information-heavy UI), it was very easy to saturate memory bandwidth. And once you saturate memory bandwidth, you end up having to block somewhere, and painting gets delayed. We’re assuming UI updates are asynchronous (because of course – otherwise we’re blocking on the main thread). I suggest that it’s worth tracking frame time, and only allowing large asynchronous transfers (e.g. texture upload, scaling, format transforms) to take a certain amount of time. After that time has expired, it should wait on the next frame to be composited before resuming (assuming there is a composite scheduled). If the composited frame was delayed to the point that it skipped a frame compared to the last unladen composite, the amount of time dedicated to transfers should be reduced, or the transfer should be delayed until some arbitrary time (i.e. it should only be considered ok to skip a frame every X ms).
It’s interesting that you can see something very similar to this happening in early versions of iOS (I don’t know if it still happens or not) – when scrolling long lists with images that load in dynamically, none of the images will load while the list is animating. The user response was paramount, to the point that it was considered more important to present consistent response than it was to present complete UI. This priority, I think, is a lot of the reason the iPhone feels ‘magic’ and Android phones felt like junk up until around 4.0 (where it’s better, but still not as good as iOS).
4. Level-of-detail
This is something that I did get to partially implement while working on Firefox for Android, though I didn’t do such a great job of it so its current implementation is heavily compromised from how I wanted it to work. This is another idea stolen from game development. There will be times, during certain interactions, where processing time will be necessarily limited. Quite often though, during these times, a user’s view of the UI will be compromised in some fashion. It’s important to understand that you don’t always need to present the full-detail view of a UI. In Firefox for Android, this took the form that when scrolling fast enough that rendering couldn’t keep up, we would render at half the resolution. This let us render more, and faster, giving the impression of a consistent UI even when the hardware wasn’t quite capable of it. I notice Microsoft doing similar things since Windows 8; notice how the quality of image scaling reduces markedly while scrolling or animations are in progress. This idea is very implementation-specific. What can be dropped and what you want to drop will differ between platforms, form-factors, hardware, etc. Generally though, some things you can consider dropping: Sub-pixel anti-aliasing, high-quality image scaling, render resolution, colour-depth, animations. You may also want to consider showing partial UI if you know that it will very quickly be updated. The Android web-browser during the Honeycomb years did this, and I attempted (with limited success, because it’s hard…) to do this with Firefox for Android many years ago.
Pitfalls
I think it’s easy to read ideas like this and think it boils down to “do everything asynchronously”. Unfortunately, if you take a naïve approach to that, you just end up with something that can be inexplicably slow sometimes and the only way to fix it is via profiling and micro-optimisations. It’s very hard to guarantee a consistent experience if you don’t manage when things happen. Yes, do everything asynchronously, but make sure you do your book-keeping and you manage when it’s done. It’s not only about splitting work up, it’s about making sure it’s done when it’s smart to do so.
You also need to be careful about how you measure these improvements, and to be aware that sometimes results in synthetic tests will even correlate to the opposite of the experience you want. A great example of this, in my opinion, is page-load speed on desktop browsers. All the major desktop browsers concentrate on prioritising the I/O and computation required to get the page to 100%. For heavy desktop sites, however, this means the browser is often very clunky to use while pages are loading (yes, even with out-of-process tabs – see the point about bandwidth above). I highlight this specifically on desktop, because you’re quite likely to not only be browsing much heavier sites that trigger this behaviour, but also to have multiple tabs open. So as soon as you load a couple of heavy sites, your entire browsing experience is compromised. I wouldn’t mind the site taking a little longer to load if it didn’t make the whole browser chug while doing so.
Don’t lose sight of your goals. Don’t compromise. Things might take longer to complete, deadlines might be missed… But polish can’t be overrated. Polish is what people feel and what they remember, and the lack of it can have a devastating effect on someone’s perception. It’s not always conscious or obvious either, even when you’re the developer. Ask yourself “Am I fully satisfied with this” before marking something as complete. You might still be able to ship if the answer is “No”, but make sure you don’t lose sight of that and make sure it gets the priority it deserves.
One last point I’ll make; I think to really execute on all of this, it requires buy-in from everyone. Not just engineers, not just engineers and managers, but visual designers, user experience, leadership… Everyone. It’s too easy to do a job that’s good enough and it’s too much responsibility to put it all on one person’s shoulders. You really need to be on the ball to produce the kind of software that Apple does almost routinely, but as much as they’d say otherwise, it isn’t magic.
May 27, 2017 12:00 PM
February 23, 2017
Keeping up my yearly blogging cadence, it’s about time I wrote to let people know what I’ve been up to for the last year or so at Mozilla. People keeping up would have heard of the sad news regarding the Connected Devices team here. While I’m sad for my colleagues and quite disappointed in how this transition period has been handled as a whole, thankfully this hasn’t adversely affected the Vaani project. We recently moved to the Emerging Technologies team and have refocused on the technical side of things, a side that I think most would agree is far more interesting, and also far more suited to Mozilla and our core competence.
Project DeepSpeech
So, out with Project Vaani, and in with Project DeepSpeech (name will likely change…) – Project DeepSpeech is a machine learning speech-to-text engine based on the Baidu Deep Speech research paper. We use a particular layer configuration and initial parameters to train a neural network to translate from processed audio data to English text. You can see roughly how we’re progressing with that here. We’re aiming for a 10% Word Error Rate (WER) on English speech at the moment.
You may ask, why bother? Google and others provide state-of-the-art speech-to-text in multiple languages, and in many cases you can use it for free. There are multiple problems with existing solutions, however. First and foremost, most are not open-source/free software (at least none that could rival the error rate of Google). Secondly, you cannot use these solutions offline. Third, you cannot use these solutions for free in a commercial product. The reason a viable free software alternative hasn’t arisen is mostly down to the cost and restrictions around training data. This makes the project a great fit for Mozilla as not only can we use some of our resources to overcome those costs, but we can also use the power of our community and our expertise in open source to provide access to training data that can be used openly. We’re tackling this issue from multiple sides, some of which you should start hearing about Real Soon Now™.
The whole team has made contributions to the main code. In particular, I’ve been concentrating on exporting our models and writing clients so that the trained model can be used in a generic fashion. This lets us test and demo the project more easily, and also provides a lower barrier for entry for people that want to try out the project and perhaps make contributions. One of the great advantages of using TensorFlow is how relatively easy it makes it to both understand and change the make-up of the network. On the other hand, one of the great disadvantages of TensorFlow is that it’s an absolute beast to build and integrates very poorly with other open-source software projects. I’ve been trying to overcome this by writing straight-forward documentation, and hopefully in the future we’ll be able to distribute binaries and trained models for multiple platforms.
Getting Involved
We’re still at a fairly early stage at the moment, which means there are many ways to get involved if you feel so inclined. The first thing to do, in any case, is to just check out the project and get it working. There are instructions provided in READMEs to get it going, and fairly extensive instructions on the TensorFlow site on installing TensorFlow. It can take a while to install all the dependencies correctly, but at least you only have to do it once! Once you have it installed, there are a number of scripts for training different models. You’ll need a powerful GPU(s) with CUDA support (think GTX 1080 or Titan X), a lot of disk space and a lot of time to train with the larger datasets. You can, however, limit the number of samples, or use the single-sample dataset (LDC93S1) to test simple code changes or behaviour.
One of the fairly intractable problems about machine learning speech recognition (and machine learning in general) is that you need lots of CPU/GPU time to do training. This becomes a problem when there are so many initial variables to tweak that can have dramatic effects on the outcome. If you have the resources, this is an area that you can very easily help with. What kind of results do you get when you tweak dropout slightly? Or layer sizes? Or distributions? What about when you add or remove layers? We have fairly powerful hardware at our disposal, and we still don’t have conclusive results about the affects of many of the initial variables. Any testing is appreciated! The Deep Speech 2 paper is a great place to start for ideas if you’re already experienced in this field. Note that we already have a work-in-progress branch implementing some of these ideas.
Let’s say you don’t have those resources (and very few do), what else can you do? Well, you can still test changes on the LDC93S1 dataset, which consists of a single sample. You won’t be able to effectively tweak initial parameters (as unsurprisingly, a dataset of a single sample does not represent the behaviour of a dataset with many thousands of samples), but you will be able to test optimisations. For example, we’re experimenting with model quantisation, which will likely be one of multiple optimisations necessary to make trained models usable on mobile platforms. It doesn’t particularly matter how effective the model is, as long as it produces consistent results before and after quantisation. Any optimisation that can be made to reduce the size or the processor requirement of training and using the model is very valuable. Even small optimisations can save lots of time when you start talking about days worth of training.
Our clients are also in a fairly early state, and this is another place where contribution doesn’t require expensive hardware. We have two clients at the moment. One written in Python that takes advantage of TensorFlow serving, and a second that uses TensorFlow’s native C++ API. This second client is the beginnings of what we hope to be able to run on embedded hardware, but it’s very early days right now.
And Finally
Imagine a future where state-of-the-art speech-to-text is available, for free (in cost and liberty), on even low-powered devices. It’s already looking like speech is going to be the next frontier of human-computer interaction, and currently it’s a space completely tied up by entities like Google, Amazon, Microsoft and IBM. Putting this power into everyone’s hands could be hugely transformative, and it’s great to be working towards this goal, even in a relatively modest capacity. This is the vision, and I look forward to helping make it a reality.
February 23, 2017 04:55 PM
October 31, 2016
I wrote earlier about my initial experience with triaging frequent intermittent test failures. I was happy to find that most of the most-frequent test failures were under active investigation, but that also meant that finding important bugs in need of triage was a frustrating and time consuming process.
Thankfully, :ekyle provided me with a script to identify “neglected oranges”: Frequent intermittent test failure bugs with no recent comments. The neglected oranges script provides search results not unlike the default search on Orange Factor, but filters out bugs with recent comments from non-robots. It also shows the bug age and how long it has been since the last comment:

This has provided a treasure trove of bugs for triage.
So, now that I can find bugs for frequent intermittent failures that don’t have anyone actively working on them, can I instigate action? Does this type of triage lead to bug resolution and a reduction in Orange Factor (average number of failures per push)? Here’s one way of looking at it: If I look at the bugs I’ve recently triaged and look at the time those bugs were open before I commented on them, I find that, on average, those bugs were open for 65 days before my triage comment. Typically I tried to find someone familiar with the bug and pointed out that it was a frequently failing test; sometimes I offered some insight, or suggested some action (“this is a timeout in a long-running test; if it cannot be optimized or split up, requestLongerTimeout() should avoid the timeout”). On average, those bugs were resolved within 3 days of my triage comment. Wow!
I offer this evidence that triage of neglected oranges makes a difference, but also caution not to expect that much of a difference over time: I’ve chosen bugs that were open for months and with continued triage, we may quickly eliminate these long-neglected bugs (let’s hope!). I’ve also likely chosen “easy” bugs – bugs with an obvious, or at least apparent, resolution. There will also be intractable bugs, surely, and bugs without any apparent owner, or where interested parties cannot agree on a solution.
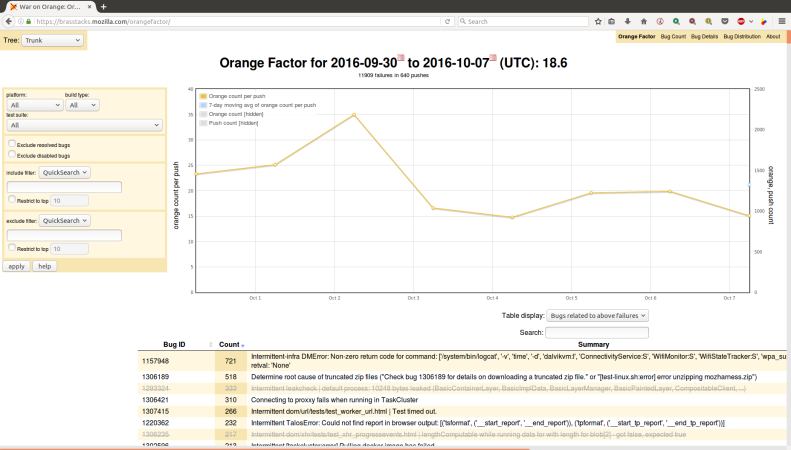
It is similarly difficult to draw conclusions from Orange Factor failure rates, but let’s look at those anyway, roughly for the time period I have been triaging:

That’s encouraging, isn’t it? I don’t know how much of that improvement was instigated by my triage comments, but I like to think I have contributed to the improvement, and that this type of action can continue to drive down failure rates. I’ll keep spending at least a few hours each week on neglected oranges, and see how that goes for the next couple of months. Can we bring Orange Factor under 10? Under 5?


October 31, 2016 08:20 PM
October 28, 2016
Many of our frequent intermittent test failures are timeouts. There are a lot of ways that a test – or a test job – can time out. Some popular bug titles demonstrate the range of failure messages:
We have tried re-wording some of these messages with the aim of clarifying the cause of the timeout and possible remedies, but I still see lots of confusion in bugs. In some cases, I think a complete explanation is much more involved than we can hope to express in an error message. I think we should write up a wiki page or MDN article with detailed explanations of messages like this, and point to that page from error messages in the test log.
One of the first things I do when I see a test failure due to timeout is look for a successful run of the same test on the same platform, and then compare the timing between the success and failure cases. If a test takes 4 seconds to run in the success case but times out after 45 seconds, perhaps there is an intermittent hang; but if the test takes 40 seconds to run successfully and intermittently times out after 45 seconds, it’s probably just a long running test with normal variation in run time.
This suggests some nice-to-have tools:
- push a new test to try, get a report of how long your test runs on each platform, perhaps with a warning if run-time approaches known time-outs, or perhaps some arbitrary threshold;
- same for longest duration without output (avoid “no output timeout”);
- use custom code or a special test harness mode to identify existing long-running tests, for proactive follow-up to prevent timeouts in the future.


October 28, 2016 06:39 PM
October 17, 2016
Recently, I have been trying to spend a little time each day looking over the most frequent intermittent test failures in search of neglected bugs. I use Orange Factor to identify the most frequent failures, then scan the associated bugs in bugzilla to see if there is someone actively working on the bug.
I have had some encouraging successes. For example, in bug 1307388, I found a frequent intermittent with no one assigned and no sign of activity. The test had started failing recently – a few days earlier – with no sign of failures before that. A quick check of the mercurial logs showed that the test had been modified the day that it started failing, and a needinfo of the patch author led to immediate action.
In bug 1244707, the bug had been triaged several months ago and assigned to backlog, but the failure frequency had since increased dramatically. Pinging someone familiar with the test quickly led to discussion and resolution.
My experience in each of these cases was really rewarding: It took me just a few minutes to review the bug and bring it to the attention of someone who was interested and understood the failure.
Finding neglected bugs is more onerous. Orange Factor can be used to identify frequent test failures; the default view on https://brasstacks.mozilla.com/orangefactor/ provides a list, ordered by frequency, but most of those are not neglected — some one is already working on them and they just need time to investigate and land a fix. I think the sheriffs do a good job of finding owners for frequent intermittents, so it seems like 90% of the top intermittents have owners, and they are usually actively working on resolving those issues. I don’t think there’s any way to see that activity on Orange Factor:

So I end up opening lots of bugs each day before I find one that “needs help”. Broadly speaking, I’m looking for a search for bugs matching something like:
- intermittent test failure
- fails frequently (OrangeFactor Robot’s daily comment?)
- no recent (last 7 days?) human-generated (not OrangeFactor Robot) bug comments
OrangeFactor does a good job of identifying the frequent failures, but I don’t think it has any data on bug activity…and this notion of bug activity is hazy anyway. Ping me if you have a better intermittent orange triage procedure, or thoughts on how to do this more efficiently.
** Update – I’ve been getting lots of ideas from folks on irc for better triaging:
ryanvm
- look to aurora/beta for bugs that have been around for longer
- would be nice if a dashboard would show trends for a bug (now happening more frequently, etc) – like socorro
- bugzilla data fed to presto, so marrying it to treeherder with redash may be possible (mdoglio may know more)
wlach
- might be able to use redash for change detection/trends once treeherder’s db is hooked up to it
ekyle
- there’s an OrangeFactorv2 planned
- the bugzilla es cluster has all bug data in easy to query format


October 17, 2016 08:11 PM
October 13, 2016
Normal releases are consistent and predictable. Scheduled releases benefit developers, testers, support and PR. Unpredictable releases can cause communication problems, stress and fatigue. Those can lead to poor software quality and developer turn-over.
Sometimes we need to deal with unexpected issues that can’t wait for a normal release. Some examples include:
- High volume crashes
- Broken functionality
- Security issues
- Special date-based features
Anyone should be able to suggest an off-cycle release, so make sure there’s a straightforward, simple process for doing it. Identify that a special release is really necessary. Maybe the issue can wait for the next normal release. Consider using an approval process to decide if the release is warranted. An approval process creates a small hurdle that forces some justification. An off-cycle release is not cheap and has potential to derail the normal release process. Don’t put the normal release cycle at risk.
Some things to keep in mind:
- Clearly identify the need. If you can’t, you probably don’t need the release.
- Limit the scope of work to just what needs to be done for the issue. Be laser focused.
- Make sure the work can be completed within the shortened cycle. Otherwise, just let the work happen in the normal release flow.
- Choose an owner to drive the release and a set of stakeholders that need to track the release.
- Triage frequently to make sure the short cycle stays on track. Over-communicate.
- Test and verify the code changes. By limiting the scope, you should also be limiting the amount of required testing.
Be ready for the unexpected. Get really good at it. The best releases are boring releases.
October 13, 2016 02:41 PM
October 07, 2016
Our automated tests seem to fail a lot. Instead of a sea of green, a typical good push often looks more like:

I’ve been thinking about ways that we can improve on that: Ways that we can reduce those pesky intermittent oranges.
Here’s one idea: Be more aggressive about disabling (skipping) tests that fail intermittently.
For today anyway, let’s put aside those tests that fail infrequently. If a test fails only rarely, there’s less to be gained by skipping it. It may also be harder to reproduce such failures, and harder to fix them and get them running again.
Instead, let’s concentrate (for now) on frequent, persistent test failures. There are lots of them:
Notice that the most frequent intermittent failure for this one-week period is bug 1157948, which failed 721 times (well, it was reported/starred 721 times — it probably failed more than that!). Guess what happened the week before that? Yeah, another 700 or so oranges. And the week before that and … This is definitely a persistent, frequent intermittent failure.
I am actually intimately familiar with bug 1157948. I’ve worked hard to resolve it, and lots of other people have too, and I’m hopeful that a fix is landing for it right now. Still, it took over 3 months to fix this. What did we gain by running the affected tests for those 3 months? Was it worth the 10000+ failures that sheriffs and developers saw, read, diagnosed, and starred?
Bug 1157948 affected all taskcluster-initiated Android tests, so skipping the affected tests would have meant losing a lot of coverage. But it is not difficult to find other bugs with over 100 failures per week that affect just one test (like bug 1305601, just to point out an example). It would be easy to disable (skip-if annotate) this test while we work on it, and wouldn’t that be better? It won’t be fixed overnight, but it will continue to fail overnight — and there’s a cost to that.
There’s a trade-off here for sure. A skipped test means less coverage. If another change causes a spontaneous fix to this test, we won’t notice the change if it is skipped. And we won’t notice a change in the frequency of failures. How important are these considerations, and are they important enough that we can live with seeing, reporting, and tracking all these test failures?
I’m not yet sure about the particulars of when and how to skip intermittent failures, but it feels like we would profit by being more aggressive about skipping troublesome tests, particularly those that fail frequently and persistently.


October 07, 2016 11:16 PM
September 30, 2016
Highlights:
- Recent outstanding improvements in APK size, memory use, and startup time, all due to :esawin’s efforts in bug 1291424.
APK Size
You can see the size of every build on treeherder using Perfherder.
Here’s how the APK size changed over the quarter, for mozilla-central Android 4.0 API15+ opt builds:

As seen in the past, the APK size seems to gradually increase over time. But this quarter there is a pleasant surprise, with a recent very large improvement. That is :esawin’s change from bug 1291424. Nice!
Memory
We track some memory metrics using test_awsy_lite.

Again, there is a tremendous improvement with bug 1291424. Thankyou :esawin!
Autophone-Talos
This section tracks Perfherder graphs for mozilla-central builds of Firefox for Android, for Talos tests run on Autophone, on android-6-0-armv8-api15. The test names shown are those used on treeherder. See https://wiki.mozilla.org/Buildbot/Talos for background on Talos.
tsvgx
An svg-only number that measures SVG rendering performance. About half of the tests are animations or iterations of rendering. This ASAP test (tsvgx) iterates in unlimited frame-rate mode thus reflecting the maximum rendering throughput of each test. The reported value is the page load time, or, for animations/iterations – overall duration the sequence/animation took to complete. Lower values are better.
tp4m
Generic page load test. Lower values are better.

No significant improvements or regressions noted for tsvgx or tp4m.
Autophone
Throbber Start / Throbber Stop
Browser startup performance is measured on real phones (a variety of popular devices).
Here’s a quick summary for the local blank page test on various devices:

Again, there is an excellent performance improvement with bug 1291424. Yahoo!
See bug 953342 to track autophone throbber regressions (none this quarter).


September 30, 2016 07:57 PM
September 14, 2016
We all want to ship as fast as possible, while making sure we can control the quality of our product. Continuous deployment means we can ship at any time, right? Well, we still need to balance the unstable and stable parts of the codebase.
Web Deploys vs Application Deploys
The ability to control changes in your stable codebase is usually the limiting factor in how quickly and easily you can ship your product to people. For example, web products can ship frequently because it’s somewhat easy to control the state of the product people are using. When something is updated on the website, users get the update when loading the content or refreshing the page. With mobile applications, it can be harder to control the version of the product people are using. After pushing an update to the store, people need to update the application on their devices. This takes time and it’s disruptive. It’s typical for several versions of a mobile application to be active at any given time.
It’s common for mobile application development to use time-based deployment windows, such as 2 or 4 weeks. Every few weeks, the unstable codebase is promoted to the stable codebase and tasks (features and bug fixes) which are deemed stable are made ready to deploy. Getting ready to deploy could mean running a short Beta, to test the release candidate with a larger, more varied, test group.
It’s important to remember, these deployment windows are not development sprints! They are merely opportunities to deploy stable code. Some features or bug fixes could take many weeks to complete. Once complete, the code can be deployed at the next window.
Tracking the Tasks
Just because you use 2 week deployment windows doesn’t mean you can really ship a quality product every 2 weeks. The deployment window is an artificial framework we create to add some structure to the process. At the core, we need to be able to track the tasks. What is a task? Let’s start with something that’s easy to visualize: a feature.
What work goes into getting a feature shipped?
- Planning: Define and scope the work.
- Design: Design the UI and experience.
- Coding: Do the implementation. Iterate with designers & product managers.
- Reviewing: Examine & run the code, looking for problems. Code is ready to land after a successful review. Otherwise, it goes back to coding to fix issues.
- Testing: Test that the feature is working correctly and nothing broke in the process. Defects might require sending the work back to development.
- Push to Stable: Once implemented, tested and verified, the code can be moved to the stable codebase.
In the old days, this was a waterfall approach. These days, we can use iterative, overlapping processes. A flow might crudely look like this:

Each of these steps takes a non-zero amount of time. Some have to be repeated. The goal is to create a feature that has the desired behavior and at a known level of quality. Note that landing the code is not the final step. The work can only be called complete when it’s been verified as stable enough to ship.
Bug fixes are similar to features. The flow might look like this:

Imagine you have many of these flows happening at the same time. Ongoing work happens on the unstable codebase. As work is completed, tested and verified at an expectable level of quality, it can be moved to the stable codebase. All work happens on the unstable codebase. Try very hard to keep work on the stable codebase to a minimum – usually disabling/enabling code or backing out unstable code.
Crash Landings
One practice I’ve seen happen on development teams is attempting to crash land code right before a deployment window. This is bad for a few reasons:
- It forces many code reviews to happen simultaneously across the team, leading to delays since code review is an iterative cycle.
- It forces large amounts of code to be merged during a short time period, likely leading to merge conflicts – leading to more delays.
- It forces a lot of testing to happen at the same time, leading to backlogs and delays. Especially since testing, fixing and verifying is an iterative cycle.
The end result is anti-climatic for everyone: code landed at a deployment window is almost never shipped in the window. In fact, the delays caused by crash landing lead to a lot of code missing the deployment window.

Smooth Landings
A different approach is to spread out the code landings. Allow code reviews and testing/fixing cycles to happen in a more balanced manner. More code is verified as stable and can ship in the deployment window. Code that is not stable is disabled via build-time or runtime flags, or in extreme cases, backout out of the stable codebase.

This balanced approach also reduces the stress that accompanies rushing code reviews and testing. The process becomes more predictable and even enjoyable. Teams thrive in healthy environments.
Once you get comfortable with deployment windows and sprints being very different things, you could even start getting more creative with deployments. Could you deploy weekly? I think it’s possible, but the limiting factor becomes your ability to create stable builds, test and verify those builds and submit those builds to the store. Yes, you still need to test the release candidates and react to any unexpected outcomes from the testing. Testing the release candidates with a larger group (Beta testing) will usually turn up issues not found in other testing. At larger scales, many things thought to be only hypothetical become reality and might need to be addressed. Allowing for this type of beta testing improves quality, but may limit how short a deployment window can be.
Remember, it’s difficult to undo or remove an unexpected issue from a mobile application user population. Users are just stuck with the problem until they get around to updating to a fixed version.
I’ve seen some companies use short deployment window techniques for internal test releases, so it’s certainly possible. Automation has to play a key role, as does tracking and triaging the bugs. Risk assessment is a big part of shipping software. Know your risks, ship your software.
September 14, 2016 07:35 PM
September 12, 2016
July 18, 2016
The web as we know it basically runs on advertising. Which is not really great, for a variety of reasons. But charging people outright for content doesn't work that great either. How about bitcoin mining instead?
Webpages can already run arbitary computation on your computer, so instead of funding themselves through ads, they could instead include a script that does some mining client-side and submits the results back to their server. Instead of paying with dollars and cents you're effectively paying with electricity and compute cycles. Seems a lot more palatable to me. What do you think?
July 18, 2016 02:49 AM
July 04, 2016
Highlights:
- gradual increases in APK size and memory use
- not much change in tsvgx or tp4m
- autophone throbber data available in perfherder
APK Size
You can see the size of every build on treeherder using Perfherder.
Here’s how the APK size changed over the quarter, for mozilla-central Android 4.0 API15+ opt builds:

APK size generally grew, generally in small increments. Our APK is about 1.3 MB larger today than it was 3 months ago. The largest increase, of about 400 KB around May 4, was caused by and discussed in bug 1260208. The largest decrease, of about 200 KB around April 25, was caused by bug 1266102.
For the same period, libxul.so also generally grew gradually:

Memory
We track some memory metrics using test_awsy_lite.

These memory measurements are fairly steady over the quarter, with a gradual increase over time.
Autophone-Talos
This section tracks Perfherder graphs for mozilla-central builds of Firefox for Android, for Talos tests run on Autophone, on android-6-0-armv8-api15. The test names shown are those used on treeherder. See https://wiki.mozilla.org/Buildbot/Talos for background on Talos.
tsvgx
An svg-only number that measures SVG rendering performance. About half of the tests are animations or iterations of rendering. This ASAP test (tsvgx) iterates in unlimited frame-rate mode thus reflecting the maximum rendering throughput of each test. The reported value is the page load time, or, for animations/iterations – overall duration the sequence/animation took to complete. Lower values are better.
tp4m
Generic page load test. Lower values are better.

No significant improvements or regressions noted for tsvgx or tp4m.
Autophone
Throbber Start / Throbber Stop
Browser startup performance is measured on real phones (a variety of popular devices).
For the first time on this blog, I’ve pulled this graph from Perfherder, rather than phonedash. A wealth of throbber start/throbber stop data is now available in Perfherder. Here’s a quick summary for the local blank page test on various devices:

See bug 953342 to track autophone throbber regressions.


July 04, 2016 11:22 PM
June 01, 2016
I’m currently working on the Vaani project at Mozilla, and part of my work on that allows me to do some exploration around the topic of speech recognition and speech assistants. After looking at some of the commercial offerings available, I thought that if we were going to do some kind of add-on API, we’d be best off aping the Amazon Alexa skills JS API. Amazon Echo appears to be doing quite well and people have written a number of skills with their API. There isn’t really any alternative right now, but I actually happen to think their API is quite well thought out and concise, and maps well to the sort of data structures you need to do reliable speech recognition.
So skipping forward a bit, I decided to prototype with Node.js and some existing open source projects to implement an offline version of the Alexa skills JS API. Today it’s gotten to the point where it’s actually usable (for certain values of usable) and I’ve just spent the last 5 minutes asking it to tell me Knock-Knock jokes, so rather than waste any more time on that, I thought I’d write this about it instead. If you want to try it out, check out this repository and run npm install in the usual way. You’ll need pocketsphinx installed for that to succeed (install sphinxbase and pocketsphinx from github), and you’ll need espeak installed and some skills for it to do anything interesting, so check out the Alexa sample skills and sym-link the ‘samples‘ directory as a directory called ‘skills‘ in your ferris checkout directory. After that, just run the included example file with node and talk to it via your default recording device (hint: say ‘launch wise guy‘).
Hopefully someone else finds this useful – I’ll be using this as a base to prototype further voice experiments, and I’ll likely be extending the Alexa API further in non-standard ways. What was quite neat about all this was just how easy it all was. The Alexa API is extremely well documented, Node.js is also extremely well documented and just as easy to use, and there are tons of libraries (of varying quality…) to do what you need to do. The only real stumbling block was pocketsphinx’s lack of documentation (there’s no documentation at all for the Node bindings and the C API documentation is pretty sparse, to say the least), but thankfully other members of my team are much more familiar with this codebase than I am and I could lean on them for support.
I’m reasonably impressed with the state of lightweight open source voice recognition. This is easily good enough to be useful if you can limit the scope of what you need to recognise, and I find the Alexa API is a great way of doing that. I’d be interested to know how close the internal implementation is to how I’ve gone about it if anyone has that insider knowledge.
June 01, 2016 04:54 PM
May 20, 2016
I have some 2” wooden blinds in my house that I’ve been wanting to motorize. Why? I’m lazy and I thought it would be cool to have.
The best commercial solution for retrofitting existing blinds seems to be Somfy. They have wireless battery-powered systems and fancy-looking remotes. For new motorized blinds, Bali seems to be popular, and they use Somfy for the motorization. There are also some kickstarter things (MOVE, MySmartBlinds), but the last time I looked those didn’t really do what I want. Somfy likely has a good product, but it’s very expensive. It looks like it would cost about $150 per blind, which is just way too much for me. They want $30 just for the plastic wand that holds the batteries (8 x AA). We’re talking about a motor and a wireless controller to tell it what to do. It’s not rocket surgery, so why should it cost $150?
My requirements are:
- Ability to tilt the blinds to one of three positions (up, middle, down) remotely via some wireless interface. I don’t care about raising or lowering the entire blind.
- There must be some API for the wireless interface such that I can automate them myself (close at night, open in morning)
- Tilt multiple blinds at the same time so they look coordinated.
- Be power efficient – one set of batteries should last more than a year.
Somfy satisfies this if I also buy their “Universal RTS Interface” for $233, but that only makes their solution even more expensive. For the 6 blinds I wanted to motorize, it would cost about $1200. No way.
I’ve been meaning to get into microcontrollers for a while now, and I thought this would be the perfect project for me to start. About a year ago I bought a RedBear BLE Nano to play with some Bluetooth stuff, so I started with that. I got a hobby servo and a bunch of other junk (resistors, capacitors, etc) from Sparkfun and began flailing around while I had some time off around Christmas. The Arduino environment on the BLE Nano is a little weird, but I got things cobbled together relatively quickly. The servo was very noisy, and it’s difficult to control the speed, but it worked. Because I wanted to control multiple devices at once, BLE was not a really great option (since AFAIK there is no way to ‘broadcast’ stuff in a way that is power-efficient for the listeners), and I started looking at other options. Eventually I ran across the Moteino.
The Moteino is an Arduino clone paired with a RFM69W wireless radio, operating at either 915Mhz or 433Mhz. It also has a very efficient voltage regulator, making it suitable for battery powered applications. The creator of the board (Felix Rusu) has put in a lot of work to create libraries for the Moteino to make it useful in exactly my type of application, so I gave it a try. The RFM69 library is lovely to work with, and I was sending messages between my two Moteinos in no time. The idea is to have one Moteino connected via USB to a Linux box (I already have a BeagleBone Black) as a base station which will relay commands to the remote devices. I got my servo working again with the Moteino quickly, as most of the code Just Worked.
I started out with a hobby servo because I knew it would be easy to control, but the noise and lack of speed control really bothered me. I needed to try something else. I considered higher quality servos, a gear motor with encoder or limit switches, stepper motors, worm gear motors, etc. I was going to end up building 6 of these things to start with, so cost was definitely a big factor. I ended up settling on the 28BYJ-48 stepper motor because it is extremely cheap (about $2), relatively quiet, and let me control the speed of rotation very precisely. There is a great Arduino library for stepper motors, AccelStepper, which lets you configure acceleration/deceleration, maximum speed, etc. It also has an easy-to-use API for positioning the motor. I found a 5mm x 8mm aluminum motor coupling to connect the motor to the blinds shaft. I then used a zip tie and a piece of rubber to secure the motor to the blinds rail. This doesn’t look very professional, but it’s not something you really see (my blinds have a valance that covers the rail). A better solution involving some kind of bracket would be great, but would increase the cost and require a lot more time. Using the stepper, I was able to smoothly, quietly, and cost-effectively control the blinds.
I then started to look into power consumption. If you don’t do put anything to sleep, the power usage is pretty high. The LowPower library from Felix makes it easy to put the CPU to sleep, which helps a lot. When sleeping, the CPU uses very little power (about 3µA I think), and the radio will wake you up via interrupt if a message arrives. The radio uses roughly 17mA in receive mode, however, so that means we’d only get about a week of battery life if we used a set of high-quality AAs (3000mAh / 17mA = 176h). We need to do a lot better.
The RFM69 has a useful feature called Listen Mode that some folks on the LowPowerLabs forums have figured out how to use. In this mode, you can configure the radio to cycle between sleeping and receiving in order to reduce power consumption. There are a lot of options here, but it was discovered that you only need to be in the RX phase for 256µS in order for a message to be detected. When the radio is asleep it uses about 4µA. So if you sleep for 1s and receive for 256µS, that means your average power consumption for the radio is about 12µA. This is a dramatic improvement, and it means that the device can still respond in roughly one second, which is certainly adequate for my application. Of course, you can always trade even more responsiveness for power efficiency, and people using this method on coin cell batteries certainly do that. There is one user on the forums who has an application with an expected battery life of over 100 years on a single coin cell! I have an extension of the RFM69 library, RFM69_WL, which collected some of the other listen mode code that was floating around and extends it so you can set your own sleep/RX durations.
I’ve measured/calculated my average power consumption to be about 46µA if I run the motor for 12s per day. That comes out to over 7 years of life on a set of 4 AA batteries (Energizer Ultimate Lithium), which is an almost unbelievable number. There are several factors I am not really considering, however, such as RF noise (which wakes the radio causing increased power consumption), so the real life performance might not be very close to this. Still, if I can get 2 years on a set of 4 AAs I’ll be pretty happy.
Usually when you buy a 28BYJ-48 it will include a driver board that has a ULN2003A, some connectors, and a set of LEDs for showing which phase of the stepper is active. This is fine for testing and development, but it was going to be pretty clunky to use this in a final solution. It was time to design my first PCB!
I found out early on that it was pretty difficult to talk to other people about problems with your project without having a schematic, so I made one of those. I started with Fritzing, but moved to EAGLE when it was time to do the PCB. It seemed to be the standard thing to use, and it was free. EAGLE has a pretty steep learning curve, but some tutorials from Sparkfun helped a lot. I also got some help from the folks on the LowPowerLabs forums (TomWS, perky), who I suspect do this kind of thing for a living. You can get the EAGLE schematic and board design here.
View post on imgur.com
View post on imgur.com
I ordered my first batch of boards from Seeed Studio, as well as a bunch of supporting components from Digikey. The PCB orders typically take a little over two weeks, which is quite a bit more waiting than I’m accustomed to. I was pretty excited when they arrived, and started checking things out. I soon realized I had made a mistake. The component I had in my design for the motor connector (which is a JST-XH 5-pin) was the wrong pitch and size, so the socket I had didn’t fit. Whoops. The hardware world does not play well with my “just try some stuff” mentality from working with software. I found an EAGLE library for the JST-XH connectors, used the correct part, and ordered another batch of PCBs. This time I actually printed out my board on paper to make sure everything matched up. I had run across PCBShopper while waiting for my first batch of boards, so I decided to use a different fabricator this time. I chose Maker Studio for the second order, since I could pay about the same amount and get red boards instead of green. Another two weeks went by, and finally last week I received the boards. I assembled one last weekend using my fancy (and cheap!) new soldering station. It didn’t work! Shit! The Moteino was working fine, but the motor wasn’t moving. Something with the motor driver or connection was hosed. After probing around for a pretty long time, I finally figured out that the socket was installed backwards. It seems the pins in the EAGLE part I found were reversed. Ugh. With a lot of hassle, I was able to unsolder the connector from the board and reverse it. The silkscreen outline doesn’t match up, but whatever. It works now, which was a big relief.
View post on imgur.com
I thought about putting the board in some kind of plastic enclosure, but it was hard to find anything small enough to fit inside the rail while also being tall enough to accomodate the Moteino on headers. I’m planning to just use some extra-wide heat shrink to protect the whole thing instead, but haven’t done that yet.
Below are some photos and videos, as well as the entire list of parts I’ve used and their prices. Each device costs about $40, which is a pretty big improvement over the commercial options (except maybe the kickstarter stuff). Also important is that there are no wires or electronics visible, which was critical for the Wife Acceptance Factor (and my own, honestly).
I’m sure a real EE will look at this and think “pfft, amateur!”. And that’s fine. My goals were to learn and have fun, and they were definitely accomplished. If I also produced something usable, that’s a bonus.
View post on imgur.com
View post on imgur.com
View post on imgur.com
Bill of Materials
In order to talk to the devices from a host computer, you'll also need a Moteino USB ($27). To program the non-USB Moteinos you'll need a FTDI adapter. LowPowerLabs sells one of those for $15, but you may be able to find a better deal elsewhere.
May 20, 2016 10:00 AM
April 18, 2016
When typing on a laptop keyboard, I find that my posture tends to get very closed and hunched. To fix this I resurrected an old low-tech solution I had for this problem: using two keyboards. Simply plug in an external USB keyboard, and use one keyboard for each hand. It's like a split keyboard, but better, because you can position it wherever you want to get a posture that's comfortable for you.
I used to do this on a Windows machine back when I was working at RIM and it worked great. Recently I tried to do it on my Mac laptop, but ran into the problem where the modifier state from one keyboard didn't apply to the other keyboard. So holding shift on one keyboard and T on the other wouldn't produce an uppercase T. This was quite annoying, and it seems to be an OS-level thing. After some googling I found Karabiner which solves this problem. Well, really it appears to be a more general keyboard customization tool, but the default configuration also combines keys across keyboards which is exactly what I wanted. \o/
Of course, changing your posture won't magically fix everything - moving around regularly is still the best way to go, but for me personally, this helps a bit :)
April 18, 2016 02:32 PM
April 06, 2016
My last post talks about the initial work to create a real user analytics system based on the UI Telemetry event data collected in Firefox on Mobile. I’m happy to report that we’ve had much forward progress since then. Most importantly, we are no longer using the DIY setup on one of my Mac Minis. Working with the Mozilla Telemetry & Data team, we have a system that extracts data from UI Telemetry via Spark, imports the data into Presto-based storage, and allows SQL queries and visualization via Re:dash.
With data accessible via Re:dash, we can use SQL to focus on improving our analyses:
- Track Active users, daily & monthly
- Explore retention & churn
- Look into which features lead to retention
- Calculate user session length & event counts per session
- Use funnel analysis to evaluate A/B experiments


Roberto posted about how we’re using Parquet, Presto and Re:dash to create an SQL based query and visualization system.
April 06, 2016 04:18 AM
March 31, 2016
Highlights:
- APK size reduction for downloadable fonts
- now measuring memory via test_awsy_lite
- tsvgx and tp4m moved to Autophone
APK Size
You can see the size of every build on treeherder using Perfherder.
Here’s how the APK size changed over the quarter, for mozilla-central Android 4.0 API15+ opt builds:

The dramatic decrease in February was caused by bug 1233799, which enabled the download content service and removed fonts from the APK.
For the same period, libxul.so generally increased in size:

The recent decrease in libxul was caused by bug 1259521, an upgrade of the Android NDK.
Memory
This quarter we began tracking some memory metrics, using test_awsy_lite.

These memory measurements are generally steady over the quarter, with some small improvements.
Autophone-Talos
This section tracks Perfherder graphs for mozilla-central builds of Firefox for Android, for Talos tests run on Autophone, on android-6-0-armv8-api15. The test names shown are those used on treeherder. See https://wiki.mozilla.org/Buildbot/Talos for background on Talos.
In previous quarters, these tests were running on Pandaboards; beginning this quarter, these tests run on actual phones via Autophone.
tsvgx
An svg-only number that measures SVG rendering performance. About half of the tests are animations or iterations of rendering. This ASAP test (tsvgx) iterates in unlimited frame-rate mode thus reflecting the maximum rendering throughput of each test. The reported value is the page load time, or, for animations/iterations – overall duration the sequence/animation took to complete. Lower values are better.
tp4m
Generic page load test. Lower values are better.

No significant improvements or regressions noted for tsvgx or tp4m.
Autophone
Throbber Start / Throbber Stop
These graphs are taken from http://phonedash.mozilla.org. Browser startup performance is measured on real phones (a variety of popular devices).


There was a lot of work on Autophone this quarter, with new devices added and old devices retired or re-purposed. These graphs show devices running mozilla-central builds, of which none were in continuous use over the quarter.
Throbber Start/Stop test regressions are tracked by bug 953342; a recent regression in throbber start is under investigation in bug 1259479.
mozbench
mozbench has been retired. 
Long live arewefastyet.com!  I’ll check in on arewefastyet.com next quarter.


March 31, 2016 03:27 PM
March 17, 2016
When we started to look at different ways on how our users can discover, save, and revisit content more easily, our first initiative was to look at how one can save web content, more intuitively, and more delightfully.
What we know today
- One of the most used and discussed features in the Firefox for Android app is “Bookmarks”, the concept of saving websites to be retrieved at a later time again.
- We currently provide several home panels. One of these panels is the Reading List panel. It’s a panel that, by default, is several swipes away, located at the very far right of all the panels. We believe it deserves more prominence than that, and therefore should be brought closer to the user.
- We want to help our users explore easier ways of saving and revisiting content, especially when being offline.
- User research implies that users don’t fully utilize the potential of articles viewed in Reader View nor know how it relates to the Reading List.
What we will improve

Migration of Reading List notification
In order to consolidate and simplify the home panels, we will shift existing Reading List items such as articles, blog posts, etc. into the Bookmarks panel, and take out the Reading List panel. By converting existing Reading List items into Bookmarks, all saved articles will now become available for syncing across all Firefox account devices, a benefit we’ve been wanting to bring to our users for a long time. Existing users of the Reading List will receive a migration notification how and where to now find their existing Reading List articles.

Helper UI informing the user of offline availability
We will not only make Reader View more discoverable by restructuring the panels, but also improve the way users can learn about Reader View and its offline capability. This will be done by an initial helper UI as soon as a user saves a Reader View item for the first time, as well as further contextual hints if a user repeats the action of viewing these items.
We will provide one easy way to save and revisit. No need to decide how to to save web content anymore, whether it’s by touching the Reading List icon within Reader View or touching the Bookmark star button. Now, any link will be saved by touching the star button.

Reading List “smart folder”
In addition to saving Reader View articles to the Bookmarks list, these items will also automatically appear in a new Reading List smart folder. The idea of a smart folder is to organize content for our users, based on context and type (similar to the smart folder on Desktop called “Recently Bookmarked”).
Once a page has been saved using the star button, the URL is added to the Bookmarks panel. If the page is in Reader View at the time it is saved, we make sure to save the Reader View version for offline use. An “offline available” indicator for each saved article signals that the saved content can be revisited offline.

Snackbar notification & Bookmarks item with offline indicator
Qualitative and quantitative data will help us make further decisions and adjustments, as well as help us in defining the success of this improvement.
Feel free to follow our meta bug which outlines our current approach in more detail.
March 17, 2016 11:42 AM
March 10, 2016
As Firefox for Android drops support for ancient versions of Android, I find my collection of test phones becoming less and less relevant. For instance, I have a Galaxy S that works fine but only runs Android 2.2.1 (API 8), and I have a Galaxy Nexus that runs Android 4.0.1 (API 14). I cannot run current builds of Firefox for Android on either phone, and, perhaps because I rooted them or otherwise messed around with them in the distant past, neither phone will upgrade to a newer version of Android.
I have been letting these phones gather dust while I test on emulators, but I recently needed a real phone and managed to breathe new life into the Galaxy Nexus using an AOSP build. I wanted all the development bells and whistles and a root shell, so I made a full-eng build and I updated the Galaxy Nexus to Android 4.3 (api 18) — good enough for Firefox for Android, at least for a while!
Basically, I followed the instructions at https://source.android.com/source/requirements.html, building on Ubuntu 14.04. For the Galaxy Nexus, that broke down to:
mkdir aosp
cd aosp
repo init -u https://android.googlesource.com/platform/manifest -b android-4.3_r1 # Galaxy Nexus
repo sync (this can take several hours)
# Download all binaries from the relevant section of
#   https://developers.google.com/android/nexus/drivers .
# I used "Galaxy Nexus (GSM/HSPA+) binaries for Android 4.3 (JWR66Y)".
# Extract each (6x) downloaded archive, extracting into <aosp>.
# Execute each (6x) .sh and accept prompts, populating <aosp>/vendor.
source build/envsetup.sh
lunch full_maguro-eng
# use update-alternatives to select Java 6; I needed all 5 of these
sudo update-alternatives --config java
sudo update-alternatives --config javac
sudo update-alternatives --config javah
sudo update-alternatives --config javadoc
sudo update-alternatives --config javap
make -j4 (this can take a couple of hours)
Once make completes, I had binaries in <aosp>/out/… I put the phone in bootloader mode (hold down Volume Up + Volume Down + Power to boot Galaxy Nexus), connected it by USB and executed “fastboot -w flashall”.
Actually, in my case, fastboot could not see the connected device, unless I ran it from root. In the root account, I didn’t have the right settings, so I needed to do something like:
sudo /bin/bash
source build/envsetup.sh
lunch full_maguro-eng
fastboot -w flashall
exit
If you are following along, don’t forget to undo your java update-alternatives when you are done!
It took some time to download and build, but the procedure was fairly straight-forward and the results excellent: I feel like I have a new phone, perfectly clean and functional — and rooted!
(I have had no similar luck with the Galaxy S: AOSP binaries are only supplied for Nexus devices, and I see no AOSP instructions for the Galaxy S. Maybe it’s time to recycle this one.)


March 10, 2016 11:53 PM
March 08, 2016
Following up from my last post, I’ve had some time to research and assess the current state of embedding Gecko. This post will serve as a (likely incomplete) assessment of where we are today, and what I think the sensible path forward would be. Please note that these are my personal opinions and not those of Mozilla. Mozilla are gracious enough to employ me, but I don’t yet get to decide on our direction 
The TLDR; there are no first-class Gecko embedding solutions as of writing.
EmbedLite (aka IPCLite)
EmbedLite is an interesting solution for embedding Gecko that relies on e10s (Electrolysis, Gecko’s out-of-process feature code-name) and OMTC (Off-Main-Thread Compositing). From what I can tell, the embedding app creates a new platform-specific compositor object that attaches to a window, and with e10s, a separate process is spawned to handle the brunt of the work (rendering the site, running JS, handling events, etc.). The existing widget API is exposed via IPC, which allows you to synthesise events, handle navigation, etc. This builds using the xulrunner application target, which unfortunately no longer exists. This project was last synced with Gecko on April 2nd 2015 (the day before my birthday!).
The most interesting thing about this project is how much code it reuses in the tree, and how little modification is required to support it (almost none – most of the changes are entirely reasonable, even outside of an embedding context). That we haven’t supported this effort seems insane to me, especially as it’s been shipping for a while as the basis for the browser in the (now defunct?) Jolla smartphone.
Building this was a pain, on Fedora 22 I was not able to get the desktop Qt build to compile, even after some effort, but I was able to compile the desktop Gtk build (trivial patches required). Unfortunately, there’s no support code provided for the Gtk version and I don’t think it’s worth the time me implementing that, given that this is essentially a dead project. A huge shame that we missed this opportunity, this would have been a good base for a lightweight, relatively easily maintained embedding solution. The quality of the work done on this seems quite high to me, after a brief examination.
Spidernode
Spidernode is a port of Node.js that uses Gecko’s ‘spidermonkey’ JavaScript engine instead of Chrome’s V8. Not really a Gecko embedding solution, but certainly something worth exploring as a way to enable more people to use Mozilla technology. Being a much smaller project, of much more limited scope, I had no issues building and testing this.
Node.js using spidermonkey ought to provide some interesting advantages over a V8-based Node. Namely, modern language features, asm.js (though I suppose this will soon be supplanted by WebAssembly) and speed. Spidernode is unfortunately unmaintained since early 2012, but I thought it would be interesting to do a simple performance test. Using the (very flawed) technique detailed here, I ran a few quick tests to compare an old copy of Node I had installed (~0.12), current stable Node (4.3.2) and this very old (~0.5) Spidermonkey-based Node. Spidermonkey-based Node was consistently over 3x faster than both old and current (which varied very little in performance). I don’t think you can really draw any conclusions than this, other than that it’s an avenue worth exploring.
Many new projects are prototyped (and indeed, fully developed) in Node.js these days; particularly Internet-Of-Things projects. If there’s the potential for these projects to run faster, unchanged, this seems like a worthy project to me. Even forgetting about the advantages of better language support. It’s sad to me that we’re experimenting with IoT projects here at Mozilla and so many of these experiments don’t promote our technology at all. This may be an irrational response, however.
GeckoView
GeckoView is the only currently maintained embedding solution for Gecko, and is Android-only. GeckoView is an Android project, split out of Firefox for Android and using the same interfaces with Gecko. It provides an embeddable widget that can be used instead of the system-provided WebView. This is not a first-class project from what I can tell, there are many bugs and many missing features, as its use outside of Firefox for Android is not considered a priority. Due to this dependency, however, one would assume that at least GeckoView will see updates for the foreseeable future.
I’d experimented with this in the past, specifically with this project that uses GeckoView with Cordova. I found then that the experience wasn’t great, due to the huge size of the GeckoView library and the numerous bugs, but this was a while ago and YMMV. Some of those bugs were down to GeckoView not using the shared APZC, a bug which has since been fixed, at least for Nightly builds. The situation may be better now than it was then.
The Future
This post is built on the premise that embedding Gecko is a worthwhile pursuit. Others may disagree about this. I’ll point to my previous post to list some of the numerous opportunities we missed, partly because we don’t have an embedding story, but I’m going to conjecture as to what some of our next missed opportunities might be.
IoT is generating a lot of buzz at the moment. I’m dubious that there’s much decent consumer use of IoT, at least that people will get excited about as opposed to property developers, but if I could predict trends, I’d have likely retired rich already. Let’s assume that consumer IoT will take off, beyond internet-connected thermostats (which are actually pretty great) and metered utility boxes (which I would quite like). These devices are mostly bespoke hardware running random bits and bobs, but an emerging trend seems to be Node.js usage. It might be important for Mozilla to provide an easily deployed out-of-the-box solution here. As our market share diminishes, so does our test-bed and contribution base for our (currently rather excellent) JavaScript engine. While we don’t have an issue here at the moment, if we find that a huge influx of diverse, resource-constrained devices starts running V8 and only V8, we may eventually find it hard to compete. It could easily be argued that it isn’t important for our solution to be based on our technology, but I would argue that if we have to start employing a considerable amount of people with no knowledge of our platform, our platform will suffer. By providing a licensed out-of-the-box solution, we could also enforce that any client-side interface remain network-accessible and cross-browser compatible.
A less tenuous example, let’s talk about VR. VR is also looking like it might finally break out into the mid/high-end consumer realm this year, with heavy investment from Facebook (via Oculus), Valve/HTC (SteamVR/Vive), Sony (Playstation VR), Microsoft (HoloLens), Samsung (GearVR) and others. Mozilla are rightly investing in WebVR, but I think the real end-goal for VR is an integrated device with no tether (certainly Microsoft and Samsung seem to agree with me here). So there may well be a new class of device on the horizon, with new kinds of browsers and ways of experiencing and integrating the web. Can we afford to not let people experiment with our technology here? I love Mozilla, but I have serious doubts that the next big thing in VR is going to come from us. That there’s no supported way of embedding Gecko worries me for future classes of device like this.
In-vehicle information/entertainment systems are possibly something that will become more of the norm, now that similar devices have become such commodity. Interestingly, the current big desktop and mobile players have very little presence here, and (mostly awful) bespoke solutions are rife. Again, can we afford to make our technology inaccessible to the people that are experimenting in this area? Is having just a good desktop browser enough? Can we really say that’s going to remain how people access the internet for the next 10 years? Probably, but I wouldn’t want to bet everything on that.
A plan
If we want an embedding solution, I think the best way to go about it is to start from Firefox for Android. Due to the way Android used to require its applications to interface with native code, Firefox for Android is already organised in such a way that it is basically an embedding API (thus GeckoView). From this point, I think we should make some of the interfaces slightly more generic and remove the JNI dependency from the Gecko-side of the code. Firefox for Android would be the main consumer of this API and would guarantee that it’s maintained. We should allow for it to be built on Linux, Mac and Windows and provide the absolute minimum harness necessary to allow for it to be tested. We would make no guarantees about API or ABI. Externally to the Gecko tree, I would suggest that we start, and that the community maintain, a CEF-compatible library, at least at the API level, that would be a Tier-3 project, much like Firefox OS now is. This, to me, seems like the minimal-effort and most useful way of allowing embeddable Gecko.
In addition, I think we should spend some effort in maintaining a fork of Node.js LTS that uses spidermonkey. If we can promise modern language features and better performance, I expect there’s a user-base that would be interested in this. If there isn’t, fair enough, but I don’t think current experiments have had enough backing to ascertain this.
I think that both of these projects are important, so that we can enable people outside of Mozilla to innovate using our technology, and by osmosis, become educated about our mission and hopefully spread our ideals. Other organisations will do their utmost to establish a monopoly in any new emerging market, and I think it’s a shame that we have such a powerful and comprehensive technology platform and we aren’t enabling other people to use it in more diverse situations.
This post is some insightful further reading on roughly the same topic.
March 08, 2016 05:22 PM
March 04, 2016
“Finally! Mozilla Firefox is now available for Apple’s iOS” “Couldn’t be more excited about Firefox on iOS”. “Love having Firefox on my iPhone. Worth the wait.”
And so did the feedback go, as Mozilla entered the Apple ecosystem with its Firefox mobile browser on November 12, 2015. With over 1 million downloads in the first week of launch, it quickly gained popularity and accelerated to the top spot in the iPad Utility category in nearly 50 countries. Initial sentiment was overwhelmingly positive, reflective of the prominent stance Firefox has among an alternative-seeking, tech-edgy aficionados who appreciate the open source environment. The launch of Firefox on iOS captivated the attention of competition and faithful users alike, and got closely examined by the press. There was a sigh of relief that Mozilla has entered this space – the familiar and favorite browser for many was the newest iTunes app store addition!
It wasn’t long before euphoria was replaced by reality. Firefox for iOS started with a carefully selected list of supported functionality. The team has made a deliberate choice to launch with a specific feature set and gradually augment the experience. We knew what we were up against, and laid out clear goals and expectations accordingly.
Since we launched, we have been closely monitoring user feedback both through iTunes Connect as well as input.mozilla.org. These forums, in addition to diary studies and other forms of user research we routinely conduct, have proven extremely valuable as they represent a fairly nuanced measure of the broad user sentiment for the Firefox for iOS app.
We noticed several main categories that capture repeated themes from comments:
- Requests to enhance search engine support
- Continue to simplify navigation in the app
- Improve robust bookmarks management
- Incorporate Content Blocking capabilities from Focus by Firefox
- Enable customization options in the app
We are hard at work addressing many of the above mentioned points with enhancements lined up for upcoming releases. In doing so, we will always try to push the envelope and delight the user by simplifying and optimizing interactions. While some features are in our control, others like setting Firefox as the default browser or providing content blocking similar to Safari, are not available on the iOS platform. Thus, we have to be creative and balance expectations and outcomes. The user feedback we have been receiving is only one of several entry points for our product prioritization and direction, albeit a very important one since it represents the “voice of the user”.
So, keep these valuable comments coming! We do read and review every bit of feedback that we receive. Scrutinize us and let us grow a product that you can’t live without on your iOS device!
To send a comment, go to settings / send feedback page in-app, or email us at: ios-feedback@mozilla.com.


March 04, 2016 08:26 PM
February 24, 2016
Strap yourself in, this is a long post. It should be easy to skim, but the history may be interesting to some. I would like to make the point that, for a web rendering engine, being embeddable is a huge opportunity, how Gecko not being easily embeddable has meant we’ve missed several opportunities over the last few years, and how it would still be advantageous to make Gecko embeddable.
What?
Embedding Gecko means making it easy to use Gecko as a rendering engine in an arbitrary 3rd party application on any supported platform, and maintaining that support. An embeddable Gecko should make very few constraints on the embedding application and should not include unnecessary resources.
Examples
- A 3rd party browser with a native UI
- A game’s embedded user manual
- OAuth authentication UI
- A web application
- ???
Why?
It’s hard to predict what the next technology trend will be, but there’s is a strong likelihood it’ll involve the web, and there’s a possibility it may not come from a company/group/individual with an existing web rendering engine or particular allegiance. It’s important for the health of the web and for Mozilla’s continued existence that there be multiple implementations of web standards, and that there be real competition and a balanced share of users of the various available engines.
Many technologies have emerged over the last decade or so that have incorporated web rendering or web technologies that could have leveraged Gecko;
(2007) iPhone: Instead of using an existing engine, Apple forked KHTML in 2002 and eventually created WebKit. They did investigate Gecko as an alternative, but forking another engine with a cleaner code-base ended up being a more viable route. Several rival companies were also interested in and investing in embeddable Gecko (primarily Nokia and Intel). WebKit would go on to be one of the core pieces of the first iPhone release, which included a better mobile browser than had ever been seen previously.
(2008) Chrome: Google released a WebKit-based browser that would eventually go on to eat a large part of Firefox’s user base. Chrome was initially praised for its speed and light-weightedness, but much of that was down to its multi-process architecture, something made possible by WebKit having a well thought-out embedding capability and API.
(2008) Android: Android used WebKit for its built-in browser and later for its built-in web-view. In recent times, it has switched to Chromium, showing they aren’t adverse to switching the platform to a different/better technology, and that a better embedding story can benefit a platform (Android’s built in web view can now be updated outside of the main OS, and this may well partly be thanks to Chromium’s embedding architecture). Given the quality of Android’s initial WebKit browser and WebView (which was, frankly, awful until later revisions of Android Honeycomb, and arguably remained awful until they switched to Chromium), it’s not much of a leap to think they may have considered Gecko were it easily available.
(2009) WebOS: Nothing came of this in the end, but it perhaps signalled the direction of things to come. WebOS survived and went on to be the core of LG’s Smart TV, one of the very few real competitors in that market. Perhaps if Gecko was readily available at this point, we would have had a large head start on FirefoxOS?
(2009) Samsung Smart TV: Also available in various other guises since 2007, Samsung’s Smart TV is certainly the most popular smart TV platform currently available. It appears Samsung built this from scratch in-house, but it includes many open-source projects. It’s highly likely that they would have considered a Gecko-based browser if it were possible and available.
(2011) PhantomJS: PhantomJS is a headless, scriptable browser, useful for testing site behaviour and performance. It’s used by several large companies, including Twitter, LinkedIn and Netflix. Had Gecko been more easily embeddable, such a product may well have been based on Gecko and the benefits of that would be many sites that use PhantomJS for testing perhaps having better rendering and performance characteristics on Gecko-based browsers. The demand for a Gecko-based alternative is high enough that a similar project, SlimerJS, based on Gecko was developed and released in 2013. Due to Gecko’s embedding deficiencies though, SlimerJS is not truly headless.
(2011) WIMM One: The first truly capable smart-watch, which generated a large buzz when initially released. WIMM was based on a highly-customised version of Android, and ran software that was compatible with Android, iOS and BlackBerryOS. Although it never progressed past the development kit stage, WIMM was bought by Google in 2012. It is highly likely that WIMM’s work forms the base of the Android Wear platform, released in 2014. Had something like WebOS been open, available and based on Gecko, it’s not outside the realm of possibility that this could have been Gecko based.
(2013) Blink: Google decide to fork WebKit to better build for their own uses. Blink/Chromium quickly becomes the favoured rendering engine for embedding. Google were not afraid to introduce possible incompatibility with WebKit, but also realised that embedding is an important feature to maintain.
(2014) Android Wear: Android specialised to run on watch hardware. Smart watches have yet to take off, and possibly never will (though Pebble seem to be doing alright, and every major consumer tech product company has launched one), but this is yet another area where Gecko/Mozilla have no presence. FirefoxOS may have lead us to have an easy presence in this area, but has now been largely discontinued.
(2014) Atom/Electron: Github open-sources and makes available its web-based text editor, which it built on a home-grown platform of Node.JS and Chromium, which it later called Electron. Since then, several large and very successful projects have been built on top of it, including Slack and Visual Studio Code. It’s highly likely that such diverse use of Chromium feeds back into its testing and development, making it a more robust and performant engine, and importantly, more widely used.
(2016) Brave: Former Mozilla co-founder and CTO heads a company that makes a new browser with the selling point of blocking ads and tracking by default, and doing as much as possible to protect user privacy and agency without breaking the web. Said browser is based off of Chromium, and on iOS, is a fork of Mozilla’s own WebKit-based Firefox browser. Brendan says they started based off of Gecko, but switched because it wasn’t capable of doing what they needed (due to an immature embedding API).
Current state of affairs
Chromium and V8 represent the state-of-the-art embeddable web rendering engine and JavaScript engine and have wide and varied use across many platforms. This helps reenforce Chrome’s behaviour as the de-facto standard and gradually eats away at the market share of competing engines.
WebKit is the only viable alternative for an embeddable web rendering engine and is still quite commonly used, but is generally viewed as a less up-to-date and less performant engine vs. Chromium/Blink.
Spidermonkey is generally considered to be a very nice JavaScript engine with great support for new EcmaScript features and generally great performance, but due to a rapidly changing API/ABI, doesn’t challenge V8 in terms of its use in embedded environments. Node.js is likely the largest user of embeddable V8, and is favoured even by Mozilla employees for JavaScript-based systems development.
Gecko has limited embedding capability that is not well-documented, not well-maintained and not heavily invested in. I say this with the utmost respect for those who are working on it; this is an observation and a criticism of Mozilla’s priorities as an organisation. We have at various points in history had embedding APIs/capabilities, but we have either dropped them (gtkmozembed) or let them bit-rot (IPCLite). We do currently have an embedding widget for Android that is very limited in capability when compared to the default system WebView.
Plea
It’s not too late. It’s incredibly hard to predict where technology is going, year-to-year. It was hard to predict, prior to the iPhone, that Nokia would so spectacularly fall from the top of the market. It was hard to predict when Android was released that it would ever overtake iOS, or even more surprisingly, rival it in quality (hard, but not impossible). It was hard to predict that WebOS would form the basis of a major competing Smart TV several years later. I think the examples of our missed opportunities are also good evidence that opening yourself up to as much opportunity as possible is a good indicator of future success.
If we want to form the basis of the next big thing, it’s not enough to be experimenting in new areas. We need to enable other people to experiment in new areas using our technology. Even the largest of companies have difficulty predicting the future, or taking charge of it. This is why it’s important that we make easily-embeddable Gecko a reality, and I plead with the powers that be that we make this higher priority than it has been in the past.
February 24, 2016 06:10 PM
February 23, 2016
We have decided to start running A/B Testing in Firefox for Android. These experiments are intended to optimize specific outcomes, as well as, inform our long-term design decisions. We want to create the best Firefox experience we can, and these experiments will help.
The system will also allow us to throttle the release of features, called staged rollout or feature toggles, so we can monitor new features in a controlled manner across a large user base and a fragmented device ecosystem. If we need to rollback a feature for some reason, we’d have the ability to do that, quickly without needing people to update software.
Technical details:
- Mozilla Switchboard is used to control experiment segmenting and staged rollout.
- UI Telemetry is used to collect metrics about an experiment.
- Unified Telemetry is used to track active experiments so we can correlate to application usage.
What is Mozilla Switchboard?
Mozilla Switchboard is based on Switchboard, an open source SDK for doing A/B testing and staged rollouts from the folks at KeepSafe. It connects to a server component, which maintains a list of active experiments.
The SDK does create a UUID, which is stored on the device. The UUID is sent to the server, which uses it to “bucket” the client, but the UUID is never stored on the server. In fact, the server does not store any data. The server we are using was ported to Node from PHP and is being hosted by Mozilla.
We decided to start using Switchboard because it’s simple, open source, has client code for Android and iOS, saves no data on the server and can be hosted by Mozilla.
Planning Experiments
The Mobile Product and UX teams are the primary drivers for creating experiments, but as is common on the Mobile team, ideas can come from anywhere. We have been working with the Mozilla Growth team, getting a better understanding of how to design the experiments and analyze the metrics. UX researchers also have input into the experiments.
Once Product and UX complete the experiment design, Development would land code in Firefox to implement the desired variations of the experiment. Development would also land code in the Switchboard server to control the configuration of the experiment: On what channels is it active? How are the variations distributed across the user population?
Since we use Telemetry to collect metrics on the experiments, the Beta channel is likely our best time period to run experiments. Telemetry is on by default on Nightly, Aurora and Beta; and Beta is the largest user base of those three channels.
Once we decide which variation of the experiment is the “winner”, we’ll change the Switchboard server configuration for the experiment so that 100% of the user base will flow through the winning variation.
Yes, a small percentage of the Release channel has Telemetry enabled, but it might be too small to be useful for experimentation. Time will tell.
What’s Happening Now?
We are trying to be very transparent about active experiments and staged rollouts. We have a few active experiments right now.
- Onboarding A/B experiment with several variants.
- Easy entry points for accessing History and Bookmarks on the main menu.
- Experimenting with the awesomescreen behavior when displaying search results page.
You can always look at the Mozilla Switchboard configuration to see what’s happening. Over time, we’ll be adding support to Firefox for iOS as well.
February 23, 2016 05:14 AM
February 22, 2016
Firefox on Mobile has a system to collect telemetry data from user interactions. We created a simple event and session UI telemetry system, built on top of the core telemetry system. The core telemetry system has been mainly focused on performance and stability. The UI telemetry system is really focused on how people are interacting with the application itself.
Event-based data streams are commonly used to do user data analytics. We’re pretty fortunate to have streams of events coming from all of our distribution channels. I wanted to start doing different types of analyses on our data, but first I needed to build a simple system to get the data into a suitable format for hacking.
One of the best one-stop sources for a variety of user analytics is the Periscope Data blog. There are posts on active users, retention and churn, and lots of other cool stuff. The blog provides tons of SQL examples. If I could get the Firefox data into SQL, I’d be in a nice place.
Collecting Data
My first step is performing a little ETL (well, the E & T parts) on the raw data using Spark/Python framework for Mozilla Telemetry. I wanted to create two dataset:
- clients: Dataset of the unique clients (users) tracked in the system. Besides containing the unique clientId, I wanted to store some metadata, like the profile creation date. (script)
- events: Dataset of the event stream, associated to each client. The event data also has information about active A/B experiments. (script)
Building a Database
I installed Postgres on a Mac Mini (powerful stuff, I know) and created my database tables. I was periodically collecting the data via my Spark scripts and I couldn’t guarantee I wouldn’t re-collect data from the previous jobs. I couldn’t just bulk insert the data. I wrote some simple Python scripts to quickly import the data (clients & events), making sure not to create any duplicates.

I decided to start with 30 days of data from our Nightly and Beta channels. Nightly was relatively small (~330K rows of events), but Beta was more significant (~18M rows of events).
Analyzing and Visualizing
Now that I had my data, I could start exploring. There are a lot of analysis/visualization/sharing tools out there. Many are commercial and have lots of features. I stumbled across a few open-source tools:
- Airpal: A web-based query execution tool from Airbnb. Makes it easy to save and share SQL analysis queries. Works with Facebook’s PrestoDB, but doesn’t seem to create any plots.
- Re:dash: A web-based query, visualization and collaboration tool. It has tons of visualization support. You can set it up on your own server, but it was a little more than I wanted to take on over a weekend.
- SQLPad: A web-based query and visualization tool. Simple and easy to setup, so I tried using it.
Even though I wanted to use SQLPad as much as possible, I found myself spending most of my time in pgAdmin. Debugging queries, using EXPLAIN to make queries faster, and setting up indexes. It was easier in pgAdmin. Once I got the basic things figured out, I was able to more efficiently use SQLPad. Below are some screenshots using the Nightly data:


Next Steps
Now that I have Firefox event data in SQL, I can start looking at retention, churn, active users, engagement and funnel analysis. Eventually, we want this process to be automated, data stored in Redshift (like a lot of other Mozilla data) and exposed via easy query/visualization/collaboration tools. We’re working with the Mozilla Telemetry & Data Pipeline teams to make that happen.
A big thanks to Roberto Vitillo and Mark Reid for the help in creating the Spark scripts, and Richard Newman for double-dog daring me to try this.
February 22, 2016 07:31 PM
We have decided to start running A/B Testing in Firefox for Android. These experiments are intended to optimize specific outcomes, as well as, inform our long-term design decisions. We want to create the best Firefox experience we can, and these experiments will help.
The system will also allow us to throttle the release of features, called staged rollout or feature toggles, so we can monitor new features in a controlled manner across a large user base and a fragmented device ecosystem. If we need to rollback a feature for some reason, we’d have the ability to do that, quickly without needing people to update software.
Technical details:
- Mozilla Switchboard is used to control experiment segmenting and staged rollout.
- UI Telemetry is used to collect metrics about an experiment.
- Unified Telemetry is used to track active experiments so we can correlate to application usage.
What is Mozilla Switchboard?
Mozilla Switchboard is based on Switchboard, an open source SDK for doing A/B testing and staged rollouts from the folks at KeepSafe. It connects to a server component, which maintains a list of active experiments.
The SDK does create a UUID, which is stored on the device. The UUID is sent to the server, which uses it to “bucket” the client, but the UUID is never stored on the server. In fact, the server does not store any data. The server we are using was ported to Node from PHP and is being hosted by Mozilla.
We decided to start using Switchboard because it’s simple, open source, has client code for Android and iOS, saves no data on the server and can be hosted by Mozilla.
Planning Experiments
The Mobile Product and UX teams are the primary drivers for creating experiments, but as is common on the Mobile team, ideas can come from anywhere. We have been working with the Mozilla Growth team, getting a better understanding of how to design the experiments and analyze the metrics. UX researchers also have input into the experiments.
Once Product and UX complete the experiment design, Development would land code in Firefox to implement the desired variations of the experiment. Development would also land code in the Switchboard server to control the configuration of the experiment: On what channels is it active? How are the variations distributed across the user population?
Since we use Telemetry to collect metrics on the experiments, the Beta channel is likely our best time period to run experiments. Telemetry is on by default on Nightly, Aurora and Beta; and Beta is the largest user base of those three channels.
Once we decide which variation of the experiment is the “winner”, we’ll change the Switchboard server configuration for the experiment so that 100% of the user base will flow through the winning variation.
Yes, a small percentage of the Release channel has Telemetry enabled, but it might be too small to be useful for experimentation. Time will tell.
What’s Happening Now?
We are trying to be very transparent about active experiments and staged rollouts. We have a few active experiments right now.
- Onboarding A/B experiment with several variants.
- Easy entry points for accessing History and Bookmarks on the main menu.
- Experimenting with the awesomescreen behavior when displaying search results page.
You can always look at the Mozilla Switchboard configuration to see what’s happening. Over time, we’ll be adding support to Firefox for iOS as well.
February 22, 2016 01:26 PM
January 31, 2016
At some point in the past, I learned about the difference between frameworks and libraries, and it struck me as a really important conceptual distinction that extends far beyond just software. It's really a distinction in process, and that applies everywhere.
The fundamental difference between frameworks and libraries is that when dealing with a framework, the framework provides the structure, and you have to fill in specific bits to make it apply to what you are doing. With a library, however, you are provided with a set of functionality, and you invoke the library to help you get the job done.
It may not seem like a very big distinction at first, but it has a huge impact on various properties of the final product. For example, a framework is easier to use if what you are trying to do lines up with the goal the framework is intended to accomplish. The only thing you need to do is provide (or override) specific things that you need to customize, and the framework takes care of the rest. It's like a builder building your house, and you picking which tile pattern you want for the backsplash. With libraries there's a lot more work - you have a Home Depot full of tools and supplies, but you have to figure out how to put them together to build a house yourself.
The flip side, of course, is that with libraries you get a lot more freedom and customizability than you do with frameworks. With the house analogy, a builder won't add an extra floor for your house if it doesn't fit with their pre-defined floorplans for the subdivision. If you're building it yourself, though, you can do whatever you want.
The library approach makes the final workflow a lot more adaptable when faced with new situations. Once you are in a workflow dictated by a framework, it's very hard to change the workflow because you have almost no control over it - you only have as much control as it was designed to let you have. With libraries you can drop a library here, pick up another one there, and evolve your workflow incrementally, because you can use them however you want.
In the context of building code, the *nix toolchain (a pile of command-line tools that do very specific things) is a great example of the library approach - it's very adaptable as you can swap out commands for other commands to do what you need. An IDE, on the other hand, is more of a framework. It's easier to get started because the heavy lifting is taken care of, all you have to do is "insert code here". But if you want to do some special processing of the code that the IDE doesn't allow, you're out of luck.
An interesting thing to note is that usually people start with frameworks and move towards libraries as their needs get more complex and they need to customize their workflow more. It's not often that people go the other way, because once you've already spent the effort to build a customized workflow it's hard to justify throwing the freedom away and locking yourself down. But that's what it feels like we are doing at Mozilla - sometimes on purpose, and sometimes unintentionally, without realizing we are putting on a straitjacket.
The shift from Bugzilla/Splinter to MozReview is one example of this. Going from a customizable, flexible tool (attachments with flags) to a unified review process (push to MozReview) is a shift from libraries to frameworks. It forces people to conform to the workflow which the framework assumes, and for people used to their own customized, library-assisted workflow, that's a very hard transition. Another example of a shift from libraries to frameworks is the bug triage process that was announced recently.
I think in both of these cases the end goal is desirable and worth working towards, but we should realize that it entails (by definition) making things less flexible and adaptable. In theory the only workflows that we eliminate are the "undesirable" ones, e.g. a triage process that drops bugs on the floor, or a review process that makes patch context hard to access. In practice, though, other workflows - both legitimate workflows currently being used and potential improved workflows get eliminated as well.
Of course, things aren't all as black-and-white as I might have made them seem. As always, the specific context/situation matters a lot, and it's always a tradeoff between different goals - in the end there's no one-size-fits-all and the decision is something that needs careful consideration.
January 31, 2016 06:26 PM
January 27, 2016
Bug 1233220 added a new Android-only mochitest-chrome test called test_awsy_lite.html. Inspired by https://www.areweslimyet.com/mobile/, test_awsy_lite runs similar code and takes similar measurements to areweslimyet.com, but runs as a simple mochitest and reports results to Perfherder.
There are some interesting trade-offs to this approach to performance testing, compared to running a custom harness like areweslimyet.com or Talos.
+ Writing and adding a mochitest is very simple.
+ It is easy to report to Perfherder (see http://wrla.ch/blog/2015/11/perfherder-onward/).
+ Tests can be run locally to reproduce and debug test failures or irregularities.
+ There’s no special hardware to maintain. This is a big win compared to ad-hoc systems that might fail because someone kicks the phone hanging off the laptop that’s been tucked under their desk, or because of network changes, or failing hardware. areweslimyet.com/mobile was plagued by problems like this and hasn’t produced results in over a year.
? Your new mochitest is automatically run on every push…unless the test job is coalesced or optimized away by SETA.
? Results are tracked in Perfherder. I am a big fan of Perfherder and think it has a solid UI that works for a variety of data (APK sizes, build times, Talos results). I expect Perfherder will accommodate test_awsy_lite data too, but some comparisons may be less convenient to view in Perfherder compared to a custom UI, like areweslimyet.com.
– For Android, mochitests are run only on Android emulators, running on aws. That may not be representative of performance on real phones — but I’m hoping memory use is similar on emulators.
– Tests cannot run for too long. Some Talos and other performance tests run many iterations or pause for long periods of time, resulting in run-times of 20 minutes or more. Generally, a mochitest should not run for that long and will probably cause some sort of timeout if it does.
For test_awsy_lite.html, I took a few short-cuts, worth noting:
- test_awsy_lite only reports “Resident memory” (RSS); other measurements like “Explicit memory” should be easy to add;
- test_awsy_lite loads fewer pages than areweslimyet.com/mobile, to keep run-time manageable; it runs in about 10 minutes, using about 6.5 minutes for page loads.
Results are in Perfherder. Add data for “android-2-3-armv7-api9” or “android-4-3-armv7-api15” and you will see various tests named “Resident Memory …”, each corresponding to a traditional areweslimyet.com measurement.


January 27, 2016 01:39 PM
January 05, 2016
It seems common for people have the same expectations for browsers on Mobile as they do on Desktop. Why is that? I’d rather create a set of Mobile-specific expectations for a browser. Mobile is very application-centric and those applications play a large role in how people use devices. When defining what success means for Firefox on Mobile, we should be thinking about Firefox as an application, not as a browser.
Navigation
Let’s start with navigation. On Desktop, navigation typically starts in a browser. On Mobile, navigation starts on the device home screen. The home screen holds a collection of applications that provide a very task-based workflow. This means you don’t need a browser to do many tasks on Mobile. In fact, a browser is somewhat secondary – it’s where you can end up after starting in a task-specific application. That’s the opposite of Desktop.
One way we started to optimize for this situation is Tab Queues: A way to send content to Firefox, in the background, without leaving your current task/application.
Another way to fit into home screen navigation is to launch favorite websites directly from home screen icons. On Android, Chrome and Firefox have supported this feature for some time, but Google’s Progressive Web Apps initiative will push the concept forward.
If the home screen is the primary way to start navigation, we can add more entry points (icons) for specific Firefox features. We already have a Search activity and we also have access to Logins/Passwords. Both of those could be put on the home screen, if the user chooses, to allow faster access.
Unsurprisingly, a correlation between applications on the home screen and application usage was a key takeaway from a recent comScore study:
“App usage is a reflexive, habitual behavior where those occupying the best home screen real estate are used most frequently.”
Content and Tasks
Creating a path to success means looking for opportunities that we can leverage. Let’s look at analyst reports for situations where browsing is used more than applications on Mobile:
- Accessing news and information sources
- Research tasks and cross-brand product comparisons
- Retail, travel and shopping tasks
If this is the type of content people access using browsers on Mobile, Firefox should be optimized to handle those tasks and workflows. It’s interesting to think about how we could leverage Firefox to create solutions for these opportunities.
What if we were building a native application that allowed you to subscribe to news, blogs and articles? Would we create a view specific to discovering content? Would we use your browsing history to help recommend content?
What if we were building a native application designed to make researching a topic or product easier? How is that different than a generic tabbed browser?
Some ideas might end up being separate applications themselves, using Firefox as a secondary activity. That keeps Firefox focused on the task of browsing and viewing content, while new applications handle other specific tasks and flows. Those applications might even end up on your home screen, if you want faster access.
Retention and Engagement
Mobile applications, including browsers, struggle with user retention. Studies show that people will try out applications an average of 4.5 times before abandoning.
Browsers have a larger reach than applications on Mobile, while applications are awesome at engagement. How does a browser increase engagement? Again, we should think like an application.
What if we were building a native application that could save links to content? What other features would we add? Maybe we’d add reminders so people wouldn’t forget about those recently saved, but never viewed, links to content. Browsers don’t do that, but applications certainly do.
What if we were building a native application that allowed people to view constantly changing news, sports or retail content? We could notify (or badge parts of the UI) when new content is available on favorite sites.
Metrics
We should be measuring Firefox as an application, and not a browser. Marketshare and pageviews, compared to the OS defaults (Safari and Chrome), may not be the best way to measure success. Why should we measure our success only against how the OS defaults view web content? Why not compare Firefox against other applications?
Research tells us that anywhere from 85% to 90% of smartphone time is spent in applications, leaving 15% to 10% of time spent in browsers. Facebook is leading the pack at 13%, but the percentages drop off to single digits quickly. There is certainly an opportunity to capitalize on that 15% to 10% slice of the pie. In fact, the slice probably ends up being bigger than 15%.

Treating Firefox as an application means we don’t take on all applications, as a single category. It means we take them on individually, and I think we can create a pretty solid path to success under those conditions.
January 05, 2016 01:35 PM
January 01, 2016
I’m thrilled to announce support for Mac OS X artifact builds. Artifact builds trade expensive
compile times for (variable) download times and some restrictions on what parts of the Firefox
codebase can be modified. For Mac OS X, the downloaded binaries are about 100Mb, which might take
just a minute to fetch. The hard restriction is that only the non-compiled parts of the browser can
be developed, which means that artifact builds are really only useful for front-end developers. The
Firefox for Android front-end team has been using artifact builds with great success for almost a
year (see Build Fennec frontend fast with mach artifact! and my other posts on this blog).
I intend to update the MDN documentation and the build bootstrapper (see
Bug 1221200) as soon as I can, but in the meantime, here’s a quick start guide.
Quick start
You’ll need to have run mach mercurial-setup and installed the mozext extension (see Bug
1234912). In your mozconfig file, add the lines
ac_add_options --enable-artifact-builds
mk_add_options MOZ_OBJDIR=./objdir-artifact
You’ll want to run mach configure again to make sure the change is recognized. This sets
--disable-compile-environment and opts you in to running mach artifact install
automatically.
After this, you should find that mach build downloads and installs the required artifact
binaries automatically, based off your current Mercurial commit. To test, just try
./mach build && ./mach run
After the initial build, incremental mach build DIR should also maintain the state of the
artifact binaries — even across hg commit and hg pull && hg update.
You should find that mach build faster works as expected, and that the occasional mach build
browser/app/repackage is required.
Restrictions
Oh, so many. Here are some of the major ones:
- Right now, artifact builds are only available to developers working on Mac OS X Desktop builds
(Bug 1207890) and Firefox for Android builds. I expect Linux support to follow shortly (tracked
in Bug 1236110). Windows support is urgently needed but I don’t yet know how much work it will be
(tracked in Bug 1236111).
- Right now, artifact builds are only available to Mercurial users. There’s no hard technical
reason they can’t be made available to git users, and I expect it to happen eventually, but it’s
non-trivial and really needs a dedicated git-using engineer to scratch her own itch. This is
tracked by Bug 1234913.
- Artifact builds don’t allow developing the C++ source code. As soon as you need to change a
compiled component, you’ll need a regular build. Unfortunately, things like Telemetry are
compiled (but see tickets like Bug 1206117).
- Artifact builds are somewhat heuristic, in that the downloaded binary artifacts may not correspond
to your actual source tree perfectly. That is, we’re not hashing the inputs and mapping to a
known binary: we’re choosing binaries from likely candidates based on your version control status
and pushes to Mozilla automation. Binary mismatches for Fennec builds are rare (but do exist,
see, for example, Bug 1222636), but I expect them to be much more common for Desktop builds.
Determining if an error is due to an artifact build is a black art. We’ll all have to learn what
the symptoms look like (often, binary component UUID mismatches) and how to minimize them.
- Support for running tests is limited. I don’t work on Desktop builds myself, so I haven’t really
explored this. I expect a little work will be needed to get xpcshell tests running, since we’ll
need to arrange for a downloaded xpcshell binary to get to the right place at the right time.
Please file a bug if some test suite doesn’t work so that we can investigate.
Conclusion
Thanks to Gregory Szorc (@indygreg) and Mike Hommey for reviewing this work. Many thanks to Mark
Finkle (@mfinkle) for providing paid time for me to pursue this line of work and to the entire
Firefox for Android team for being willing guinea pigs.
There’s a huge amount of work to be done here, and I’ve tried to include Bugzilla ticket links so
that interested folks can contribute or just follow along. Dan Minor will be picking up some of
this artifact build work in the first quarter of 2016.
Mozilla is always making things better for the front-end teams and our valuable contributors! Get
involved with code contribution at Mozilla!
Discussion is best conducted on the dev-builds mailing list and I’m nalexander on
irc.mozilla.org/#developers and @ncalexander on Twitter.
Changes
- Thu 31 December 2015: Initial version.
Notes
January 01, 2016 12:00 AM
December 31, 2015
Highlights:
- now measuring APK size
- tcheck2 (temporarily) retired
- tsvgx and tp4m improved – thanks :jchen!
APK Size
This quarter we began tracking the size of the Firefox for Android APK, and some of its components. You can see the size of every build on treeherder using Perfherder.
Here’s how the APK size changed over the last 2 months, for mozilla-central Android 4.0 opt builds:

There are lots of increases and a few decreases here. The most significant decrease (almost half a megabyte) is on Nov 23, from mfinkle’s change for . The most significant increase (~200K) is on Dec 20, from a Skia update, .
It is worth noting that the sizes of libxul.so over the same period were almost always increasing:

Talos
This section tracks Perfherder graphs for mozilla-central builds of Firefox for Android, for Talos tests run on Android 4.0 Opt. The test names shown are those used on treeherder. See https://wiki.mozilla.org/Buildbot/Talos for background on Talos.
We intend to retire the remaining Android Talos tests, migrating these tests to autophone in the very near future.
tcheck2
Measure of “checkerboarding” during simulation of real user interaction with page. Lower values are better.
This test is no longer running. It was noisy and needed to be rewritten for APZ. See discussion in bug 1213032 and bug 1230572.
tsvgx
An svg-only number that measures SVG rendering performance. About half of the tests are animations or iterations of rendering. This ASAP test (tsvgx) iterates in unlimited frame-rate mode thus reflecting the maximum rendering throughput of each test. The reported value is the page load time, or, for animations/iterations – overall duration the sequence/animation took to complete. Lower values are better.

730 (start of period) – 110 (end of period)
A small regression at the end of November corresponded with the introduction of APZ; it was investigated in bug 1229118. An extraordinary improvement on Dec 25 was the result of jchen’s refactoring.
tp4m
Generic page load test. Lower values are better.

730 (start of period) – 680 (end of period)
Note the same regression and improvement as seen in tsvgx.
Autophone
Throbber Start / Throbber Stop
These graphs are taken from http://phonedash.mozilla.org. Browser startup performance is measured on real phones (a variety of popular devices).


Eideticker
Android tests are no longer run on Eideticker.
mozbench
These graphs are taken from the mozbench dashboard at http://ouija.allizom.org/grafana/index.html#/dashboard/file/mozbench.json which includes some comparisons involving Firefox for Android. More info at https://wiki.mozilla.org/Auto-tools/Projects/Mozbench.

Sadly, the other mobile benchmarks have no data for most of November and December…I’m not sure why.


December 31, 2015 08:44 PM
December 24, 2015
A few weeks ago, I was trying to run Linux Debug mochitests in an unfamiliar environment and that got me to thinking about how well tests run on different computers. How much does the run-time environment – the hardware, the OS, system applications, UI, etc. – affect the reliability of tests?
At that time, Linux 64 Debug plain, non-e10s mochitests on treeherder – M(1) .. M(5) – were running well: Nearly all jobs were green. The most frequent intermittent failure was dom/html/test/test_fullscreen-api-race.html, but even that test failed only about 1 time in 10. I wondered, are those tests as reliable in other environments? Do intermittent failures reproduce with the same frequency on other computers?
Experiment: Borrow a test slave, run tests over VNC
I borrowed an aws test slave – see https://wiki.mozilla.org/ReleaseEngineering/How_To/Request_a_slave – and used VNC to access the slave and run tests. I downloaded builds and test packages from mozilla-central and invoked run_tests.py with the same arguments used for the automated tests shown on treeherder. To save time, I restricted my tests to mochitest-1, but I repeated mochitest-1 10 times. All tests passed all 10 times. Additional runs produced intermittent failures, like test_fullscreen-api-race, with approximately the same frequency reported by Orange Factor for recent builds. tl;dr Treeherder results, including intermittent failures, for mochitests can be reliably reproduced on borrowed slaves accessed with VNC.
Experiment: Run tests on my laptop
Next I tried running tests on my laptop, a ThinkPad w540 running Ubuntu 14. I downloaded the same builds and test packages from mozilla-central and invoked run_tests.py with the same arguments used for the automated tests shown on treeherder. This time I noticed different results immediately: several tests in mochitest-1 failed consistently. I investigated and tracked down some failures to environmental causes: essential components like pulseaudio or gstreamer not installed or not configured correctly. Once I corrected those issues, I still had a few permanent test failures (like dom/base/test/test_applet_alternate_content.html, which has no bugs on file) and very frequent intermittents (like dom/base/test/test_bug704320_policyset.html, which is decidedly low-frequency in Orange Factor). I also could not reproduce the most frequent mochitest-1 intermittents I found on Orange Factor and reproduced earlier on the borrowed slave. An intermittent failure like test_fullscreen-api-race, which I could generally reproduce at least once in 10 to 20 runs on a borrowed slave, I could not reproduce at all in over 100 runs on my laptop. (That’s 100 runs of the entire mochitest-1 job. I also tried running specific tests or specific directories of tests up to 1000 times, but I still could not reproduce the most common intermittent failures seen on treeherder.) tl;dr Intermittent failures seen on treeherder are frequently impossible to reproduce on my laptop; some failures seen on my laptop have never been reported before.
Experiment: Run tests on a Digital Ocean instance
Digital Ocean offers virtual servers in the cloud, similar to AWS EC2. Digital Ocean is of interest because rr can be used on Digital Ocean but not on aws. I repeated my test runs, again with the same methodology, on a Digital Ocean instance set up earlier this year for Orange Hunter.
My experience on Digital Ocean was very similar to that on my own laptop. Most tests pass, but there are some failures seen on Digital Ocean that are not seen on treeherder and not seen on my laptop, and intermittent failures which occur with some frequency on treeherder could not be reproduced on Digital Ocean.
tl;dr Intermittent failures seen on treeherder are frequently impossible to reproduce on Digital Ocean; some failures seen on Digital Ocean have never been reported before; failures on Digital Ocean are also different (or of different frequency) from those seen on my laptop.
I found it relatively easy to run Linux Debug mochitests in various environments in a manner similar to the test jobs we see on treeherder. Test results were similar to treeherder, in that most tests passed. That’s all good, and expected.
However, test results often differed in small but significant ways across environments and I could not reproduce most frequent intermittent failures seen on treeherder and tracked in Orange Factor. This is rather discouraging and the cause of the concern mentioned in my last post: While rr appears to be an excellent tool for recording and replaying intermittent test failures and seems to have minimal impact on the chances of reproducing an intermittent failure, rr cannot be run on the aws instances used to run Firefox tests in continuous integration, and it seems difficult to reproduce many intermittent test failures in different environments. (I don’t have a good sense of why this is: Timing differences, hardware, OS, system configuration?)
If rr could be run on aws, all would be grand: We could record test runs in aws with excellent chances of reproducing and recording intermittent test failures and could make those recordings available to developers interested in debugging the failures. But I don’t think that’s possible.
We had hoped that we could run tests in another environment (Digital Ocean) and observe the same failures seen on aws and reported in treeherder, but that doesn’t seem to be the case.
Another possibility is bug 1226676: We hope to start running Linux tests in a docker container soon. Once that’s working, if rr can be run in the container, perhaps intermittent failures will behave the same way and can be reproduced and recorded.


December 24, 2015 05:28 AM
December 18, 2015
rr is a lightweight debugging tool that allows program execution to be recorded and subsequently replayed and debugged. gdb-based debugging of recordings is enhanced by reverse execution.
rr can be used to record and replay Firefox and Firefox tests on Linux. See https://github.com/mozilla/rr/wiki/Recording-Firefox. If you have rr installed and have a Linux Debug build of Firefox handy, recording a mochitest is as simple as:
./mach mochitest --debugger=rr ...
For example, to record a single mochitest:
  ./mach mochitest testing/mochitest/tests/Harness_sanity/test_sanitySimpletest.html \
    --keep-open=false --debugger=rr
Even better, use –run-until-failure to repeat the mochitest until an intermittent failure occurs:
  ./mach mochitest testing/mochitest/tests/Harness_sanity/test_sanitySimpletest.html \
    --keep-open=false --run-until-failure --debugger=rr
To replay and debug the most recent recording:
rr replay
Similar techniques can be applied to reftests, xpcshell tests, etc.
For a fun and simple experiment, you can update a test to fail randomly, maybe based on Math.random(). Run the test in a loop or with –run-until-failure to reproduce your failure, then replay: Your “random” failure should occur at exactly the same point in execution on replay.
In recent weeks, I have run many mochitests on my laptop in rr, hoping to improve my understanding of how well rr can record and replay intermittent test failures.
rr has some, but only a little, effect on test run-time. I can normally run mochitest-1 via mach on my laptop in about 17 minutes; with rr, that increases to about 22 minutes (130% of normal). That’s consistent with :roc’s observations at http://robert.ocallahan.org/2015/11/even-more-rr-replay-performance.html.
I observed no difference in test results, when running on my laptop: the same tests passed and failed with or without rr, and intermittent failures occurred with approximately the same frequency with or without rr. (This may not be universal; others have noted differences: https://mail.mozilla.org/pipermail/rr-dev/2015-December/000310.html.)
So my experience with rr has been very encouraging: If I can reproduce an intermittent test failure on my laptop, I can record it with rr, then debug it at my leisure and benefit from rr “extras” like reverse execution. This seems great!
I still have a concern about the practical application of rr to recording intermittent failures reported on treeherder…I’ll try to write a follow-up post on that soon.


December 18, 2015 06:47 PM
November 30, 2015
In the Firefox family of products, we've had asynchronous scrolling (aka async pan/zoom, aka APZ, aka compositor-thread scrolling) in Firefox OS and Firefox for Android for a while - even though they had different implementations, with different behaviors. We are now in the process of taking the Firefox OS implementation and bringing it to all our other platforms - including desktop and Android. After much hard work by many people, including but not limited to :botond, :dvander, :mattwoodrow, :mstange, :rbarker, :roc, :snorp, and :tn, we finally have APZ enabled on the nightly channel for both desktop and Android. We're working hard on fixing outstanding bugs and getting the quality up before we let it ride the trains out to DevEdition, Beta, and the release channel.
If you want to try it on desktop, note that APZ requires e10s to be enabled, and is currently only enabled for mousewheel/trackpad scrolling. We do have plans to implement it for other input types as well, although that may not happen in the initial release.
Although getting the basic machinery working took some effort, we're now mostly done with that and are facing a different but equally challenging aspect of this change - the fallout on web content. Modern web pages have access to many different APIs via JS and CSS, and implement many interesting scroll-linked effects, often triggered by the scroll event or driven by a loop on the main thread. With APZ, these approaches don't work quite so well because inherently the user-visible scrolling is async from the main thread where JS runs, and we generally avoid blocking the compositor on main-thread JS. This can result in jank or jitter for some of these effects, even though the main page scrolling itself remains smooth. I picked a few of the simpler scroll effects to discuss in a bit more detail below - not a comprehensive list by any means, but hopefully enough to help you get a feel for some of the nuances here.
Smooth scrolling
Smooth scrolling - that is, animating the scroll to a particular scroll offset - is something that is fairly common on web pages. Many pages do this using a JS loop to animate the scroll position. Without taking advantage of APZ, this will still work, but can result in less-than-optimal smoothness and framerate, because the main thread can be busy with doing other things.
Since Firefox 36, we've had support for the scroll-behavior CSS property which allows content to achieve the same effect without the JS loop. Our implementation for scroll-behavior without APZ enabled still runs on the main thread, though, and so can still end up being janky if the main thread is busy. With APZ enabled, the scroll-behavior implementation triggers the scroll animation on the compositor thread, so it should be smooth regardless of load on the main thread. Polyfills for scroll-behavior or old-school implementations in JS will remain synchronous, so for best performance we recommend switching to the CSS property where possible. That way as APZ rolls out to release, you'll get the benefits automatically.
Here is a simple example page that has a spinloop to block the main thread for 500ms at a time. Without APZ, clicking on the buttons results in a very janky/abrupt scroll, but with APZ it should be smooth.
position:sticky
Another common paradigm seen on the web is "sticky" elements - they scroll with the page for a bit, and then turn into position:fixed elements after a point. Again, this is usually implemented with JS listening for scroll events and updating the styles on the elements based on the scroll offset. With APZ, scroll events are going to be delayed relative to what the user is seeing, since the scroll events arrive on the main thread while scrolling is happening on the compositor thread. This will result in glitches as the user scrolls.
Our recommended approach here is to use position:sticky when possible, which we have supported since Firefox 32, and which we have support for in the compositor. This CSS property allows the element to scroll normally but take on the behavior of position:fixed beyond a threshold, even with APZ enabled. This isn't supported across all browsers yet, but there are a number of polyfills available - see the resources tab on the Can I Use position:sticky page for some options.
Again, here is a simple example page that has a spinloop to block the main thread for 500ms at a time. With APZ, the JS version will be laggy but the position:sticky version should always remain in the right place.
Parallax
Parallax. Oh boy. There's a lot of different ways to do this, but almost all of them rely on listening to scroll events and updating element styles based on that. For the same reasons as described in the previous section, implementations of parallax scrolling that are based on scroll events are going to be lagging behind the user's actual scroll position. Until recently, we didn't have a solution for this problem.
However, a few days ago :mattwoodrow landed compositor support for asynchronous scroll adjustments of 3D transforms, which allows a pure CSS parallax implementation to work smoothly with APZ. Keith Clark has a good writeup on how to do this, so I'm just going to point you there. All of his demo pages should scroll smoothly in Nightly with APZ enabled.
Unfortunately, it looks like this CSS-based approach may not work well across all browsers, so please make sure to test carefully if you want to try it out. Also, if you have suggestions on other methods on implementing parallax so that it doesn't rely on a responsive main thread, please let us know. For example, :mstange created one at http://tests.themasta.com/transform-fixed-parallax.html which we should be able to support in the compositor without too much difficulty.
Other features
I know that there are other interesting scroll-linked effects that people are doing or want to do on the web, and we'd really like to support them with asynchronous scrolling. The Blink team has a bunch of different proposals for browser APIs that can help with these sorts of things, including things like CompositorWorker and scroll customization. For more information and to join the discussion on these, please see the public-houdini mailing list. We'd love to get your feedback!
(Thanks to :botond and :mstange for reading a draft of this post and providing feedback.)
November 30, 2015 06:32 PM
November 22, 2015
Building and shipping a successful product takes more than raw engineering. I have been posting a bit about using Telemetry to learn about how people interact with your application so you can optimize use cases. There are other types of data you should consider too. Being aware of these metrics can help provide a better focus for your work and, hopefully, have a bigger impact on the success of your product.
Active Users
This includes daily active users (DAUs) and monthly active users (MAUs). How many people are actively using the product within a time-span? At Mozilla, we’ve been using these for a long time. From what I’ve read, these metrics seem less important when compared to some of the other metrics, but they do provide a somewhat easy to measure indicator of activity.
These metrics don’t give a good indication of how much people use the product though. I have seen a variation metric called DAU/MAU (daily divided by monthly) and gives something like retention or engagement. DAU/MAU rates of 50% are seen as very good.
Engagement
This metric focuses on how much people really use the product, typically tracking the duration of session length or time spent using the application. The amount of time people spend in the product is an indication of stickiness. Engagement can also help increase retention. Mozilla collects data on session length now, but we need to start associating metrics like this with some of our experiments to see if certain features improve stickiness and keep people using the application.
We look for differences across various facets like locales and releases, and hopefully soon, across A/B experiments.
Retention / Churn
Based on what I’ve seen, this is the most important category of metrics. There are variations in how these metrics can be defined, but they cover the same goal: Keep users coming back to use your product. Again, looking across facets, like locales, can provide deeper insight.
Rolling Retention: % of new users return in the next day, week, month
Fixed Retention: % of this week’s new users still engaged with the product over successive weeks.
Churn: % of users who leave divided by the number of total users
Most analysis tools, like iTunes Connect and Google Analytics, use Fixed Retention. Mozilla uses Fixed Retention with our internal tools.
I found some nominal guidance (grain of salt required):
1-week churn: 80% bad, 40% good, 20% phenomenal
1-week retention: 25% baseline, 45% good, 65% great
Cost per Install (CPI)
I have also seen this called Customer Acquisition Cost (CAC), but it’s basically the cost (mostly marketing or pay-to-play pre-installs) of getting a person to install a product. I have seen this in two forms: blended – where ‘installs’ are both organic and from campaigns, and paid – where ‘installs’ are only those that come from campaigns. It seems like paid CPI is the better metric.
Lower CPI is better and Mozilla has been using Adjust with various ad networks and marketing campaigns to figure out the right channel and the right messaging to get Firefox the most installs for the lowest cost.
Lifetime Value (LTV)
I’ve seen this defined as the total value of a customer over the life of that customer’s relationship with the company. It helps determine the long-term value of the customer and can help provide a target for reasonable CPI. It’s weird thinking of “customers” and “value” when talking about people who use Firefox, but we do spend money developing and marketing Firefox. We also get revenue, maybe indirectly, from those people.
LTV works hand-in-hand with churn, since the length of the relationship is inversely proportional to the churn. The longer we keep a person using Firefox, the higher the LTV. If CPI is higher than LTV, we are losing money on user acquisition efforts.
Total Addressable Market (TAM)
We use this metric to describe the size of a potential opportunity. Obviously, the bigger the TAM, the better. For example, we feel the TAM (People with kids that use Android tablets) for Family Friendly Browsing is large enough to justify doing the work to ship the feature.
Net Promoter Score (NPS)
We have seen this come up in some surveys and user research. It’s suppose to show how satisfied your customers are with your product. This metric has it’s detractors though. Many people consider it a poor value, but it’s still used quiet a lot.
NPS can be as low as -100 (everybody is a detractor) or as high as +100 (everybody is a promoter). An NPS that is positive (higher than zero) is felt to be good, and an NPS of +50 is excellent.
Go Forth!
If you don’t track any of these metrics for your applications, you should. There are a lot of off-the-shelf tools to help get you started. Level-up your engineering game and make a bigger impact on the success of your application at the same time.
November 22, 2015 04:33 PM
November 20, 2015
Recent updates to mach provide support for running and debugging Firefox for Android.
When run from a Firefox for Android context, ‘mach run’ starts Firefox on a connected Android device. As with other Android mach commands, if no device is found, mach offers to start an emulator, and if Firefox is not installed, mach offers to install it.
gbrown@mozpad:~/src$ ./mach run
No Android devices connected. Start an emulator? (Y/n) y
Starting emulator running Android 4.3...
It looks like Firefox is not installed on this device.
Install Firefox? (Y/n) y
Installing Firefox. This may take a while...
 1:22.97 /usr/bin/make -C . -j8 -s -w install
 1:32.04 make: Entering directory `/home/gbrown/objdirs/droid'
 1:47.48 2729 KB/s (42924584 bytes in 15.358s)
 1:48.22     pkg: /data/local/tmp/fennec-45.0a1.en-US.android-arm.apk
 2:05.97 Success
 2:06.34 make: Leaving directory `/home/gbrown/objdirs/droid'
Starting: Intent { act=android.activity.MAIN cmp=org.mozilla.fennec_gbrown/.App }
Parameters can be passed to Firefox on the command line. For example, ‘mach run –guest’ starts Firefox in guest mode.
mach also supports gdb-based debugging with JimDB, :jchen’s celebrated fork of gdb for Firefox for Android. ‘mach run –debug’ starts JimDB. If necessary, mach will even fetch, install, and configure JimDB for you.
  $ ./mach run --debug
  JimDB (arm) not found: /home/gbrown/.mozbuild/android-device/jimdb-arm does not exist
  Download and setup JimDB (arm)? (Y/n) y
  Installing JimDB (linux64/arm). This may take a while...
  From https://github.com/darchons/android-gdbutils
   * [new branch]      master     -> origin/master
   * [new tag]         gdbutils-2 -> gdbutils-2
   * [new tag]         initial-release -> initial-release
   1:45.57 /home/gbrown/.mozbuild/android-device/jimdb-arm/bin/gdb -q --args

  Fennec GDB utilities
    (see utils/gdbinit and utils/gdbinit.local on how to configure settings)
  1. Debug Fennec (default)
  2. Debug Fennec with env vars and args
  3. Debug using jdb
  4. Debug content Mochitest
  5. Debug compiled-code unit test
  6. Debug Fennec with pid
  Enter option from above: 1

  New ADB device is "emulator-5554"
  Using device emulator-5554
  Using object directory: /home/gbrown/objdirs/droid
  Set sysroot to "/home/gbrown/.mozbuild/android-device/jimdb-arm/lib/emulator-5554".
  Updated solib-search-path.
  Ignoring BHM signal.
  Using package org.mozilla.fennec_gbrown.
  Launching org.mozilla.fennec_gbrown... Done
  Attaching to pid 674... Done
  Setting up remote debugging... Done

  Ready. Use "continue" to resume execution.
  : No such file or directory.
  (gdb)
See https://wiki.mozilla.org/Mobile/Fennec/Android/GDB for more info on JimDB.


November 20, 2015 04:05 PM
November 04, 2015
In addition to the database refactoring I mentioned a few weeks ago, some cool stuff has been going into Perfherder lately.
Tracking installer size
Perfherder is now tracking the size of the Firefox installer for the various platforms we support (bug 1149164). I originally only intended to track Android .APK size (on request from the mobile team), but installer sizes for other platforms came along for the ride. I don’t think anyone will complain. 

link
Just as exciting to me as the feature itself is how it’s implemented: I added a log parser to treeherder which just picks up a line called “PERFHERDER_DATA” in the logs with specially formatted JSON data, and then automatically stores whatever metrics are in there in the database (platform, options, etc. are automatically determined). For example, on Linux:
PERFHERDER_DATA: {"framework": {"name": "build_metrics"}, "suites": [{"subtests": [{"name": "libxul.so", "value": 99030741}], "name": "installer size", "value": 55555785}]}
This should make it super easy for people to add their own metrics to Perfherder for build and test jobs. We’ll have to be somewhat careful about how we do this (we don’t want to add thousands of new series with irrelevant / inconsistent data) but I think there’s lots of potential here to be able to track things we care about on a per-commit basis. Maybe build times (?).
More compare view improvements
I added filtering to the Perfherder compare view and added back links to the graphs view. Filtering should make it easier to highlight particular problematic tests in bug reports, etc. The graphs links shouldn’t really be necessary, but unfortunately are due to the unreliability of our data — sometimes you can only see if a particular difference between two revisions is worth paying attention to in the context of the numbers over the last several weeks.

Miscellaneous
Even after the summer of contribution has ended, Mike Ling continues to do great work. Looking at the commit log over the past few weeks, he’s been responsible for the following fixes and improvements:
- Bug 1218825: Can zoom in on perfherder graphs by selecting the main view
- Bug 1207309: Disable ‘<' button in test chooser if no test selected
- Bug 1210503 – Include non-summary tests in main comparison view
- Bug 1153956 – Persist the selected revision in the url on perfherder (based on earlier work by Akhilesh Pillai)
Next up
My main goal for this quarter is to create a fully functional interface for actually sheriffing performance regressions, to replace alertmanager. Work on this has been going well. More soon.

November 04, 2015 03:45 PM
October 23, 2015
I spent a good chunk of time last quarter redesigning how Perfherder stores its data internally. Here are some notes on this change, for posterity.
Perfherder’s data model is based around two concepts:
- Series signatures: A unique set of properties (platform, test name, suite name, options) that identifies a performance test.
- Series data: A set of measurements for a series signature, indexed by treeherder push and job information.
When it was first written, Perfherder stored the second type of data as a JSON-encoded series in a relational (MySQL) database. That is, instead of storing each datum as a row in the database, we would store sequences of them. The assumption was that for the common case (getting a bunch of data to plot on a graph), this would be faster than fetching a bunch of rows and then encoding them as JSON. Unfortunately this wasn’t really true, and it had some serious drawbacks besides.
First, the approach’s performance was awful when it came time to add new data. To avoid needing to decode or download the full stored series when you wanted to render only a small subset of it, we stored the same series multiple times over various time intervals. For example, we stored the series data for one day, one week… all the way up to one year. You can probably see the problem already: you have to decode and re-encode the same data structure many times for each time interval for every new performance datum you were inserting into the database. The pseudo code looked something like this for each push:
for each platform we're testing talos on:
  for each talos job for the platform:
    for each test suite in the talos job:
      for each subtest in the test suite:
        for each time interval in one year, 90 days, 60 days, ...:
           fetch and decode json series for that time interval from db
           add datapoint to end of series
           re-encode series as json and store in db
Consider that we have some 6 platforms (android, linux64, osx, winxp, win7, win8), 20ish test suites with potentially dozens of subtests… and you can see where the problems begin.
In addition to being slow to write, this was also a pig in terms of disk space consumption. The overhead of JSON (“{, }” characters, object properties) really starts to add up when you’re storing millions of performance measurements. We got around this (sort of) by gzipping the contents of these series, but that still left us with gigantic mysql replay logs as we stored the complete “transaction” of replacing each of these series rows thousands of times per day. At one point, we completely ran out of disk space on the treeherder staging instance due to this issue.
Read performance was also often terrible for many common use cases. The original assumption I mentioned above was wrong: rendering points on a graph is only one use case a system like Perfherder has to handle. We also want to be able to get the set of series values associated with two result sets (to render comparison views) or to look up the data associated with a particular job. We were essentially indexing the performance data only on one single dimension (time) which made these other types of operations unnecessarily complex and slow — especially as the data you want to look up ages. For example, to look up a two week old comparison between two pushes, you’d also have to fetch the data for every subsequent push. That’s a lot of unnecessary overhead when you’re rendering a comparison view with 100 or so different performance tests:

So what’s the alternative? It’s actually the most obvious thing: just encode one database row per performance series value and create indexes on each of the properties that we might want to search on (repository, timestamp, job id, push id). Yes, this is a lot of rows (the new database stands at 48 million rows of performance data, and counting) but you know what? MySQL is designed to handle that sort of load. The current performance data table looks like this:
+----------------+------------------+
| Field          | Type             |
+----------------+------------------+
| id             | int(11)          |
| job_id         | int(10) unsigned |
| result_set_id  | int(10) unsigned |
| value          | double           |
| push_timestamp | datetime(6)      |
| repository_id  | int(11)          |
| signature_id   | int(11)          |
+----------------+------------------+
MySQL can store each of these structures very efficiently, I haven’t done the exact calculations, but this is well under 50 bytes per row. Including indexes, the complete set of performance data going back to last year clocks in at 15 gigs. Not bad. And we can examine this data structure across any combination of dimensions we like (push, job, timestamp, repository) making common queries to perfherder very fast.
What about the initial assumption, that it would be faster to get a series out of the database if it’s already pre-encoded? Nope, not really. If you have a good index and you’re only fetching the data you need, the overhead of encoding a bunch of database rows to JSON is pretty minor. From my (remote) location in Toronto, I can fetch 30 days of tcheck2 data in 250 ms. Almost certainly most of that is network latency. If the original implementation was faster, it’s not by a significant amount.

Lesson: Sometimes using ancient technologies (SQL) in the most obvious way is the right thing to do. DoTheSimplestThingThatCouldPossiblyWork
October 23, 2015 06:28 PM
October 16, 2015
As I wrote in my last post, using mach to test Firefox for Android in an emulator simplifies the testing process and removes the need to connect a physical phone or tablet. Similarly, mach now looks out for and offers to “fix” some other common Android-specific complications.
The first complication is Firefox itself. “Browser tests” like mochitests and reftests run inside Firefox. On Android, that means that Firefox for Android must be installed on your device. When using a phone or tablet, you can connect it by usb, and use “mach install” to install Firefox. But you might forget — I know I forget all the time and then wonder, why didn’t my tests run?! Also, if you are running an emulator automatically from a mach test command, you may not have a chance to install Firefox. So now mach test commands that require Firefox for Android check to see if it is installed; if it isn’t, mach prompts you to install Firefox from your local build.
Another complication is the “host utilities” required for most test types on Android. Many tests make requests from Firefox (running on the Android device) back to a web server running on the local computer – the test “host”. The test harnesses automatically start that web server for you, but they need to run executables like xpcshell and ssltunnel to do so. These host utilities must run on your computer (the host driving the tests via mach and the test harnesses) rather than on Android. Your Android build probably has xpcshell and ssltunnel, but they are Android executables and will not run on the Linux or OSX that’s probably running on your host. You can set the MOZ_HOST_BIN environment variable to point to utilities suitable for your host (a desktop Firefox build will do), but if you neglect to set MOZ_HOST_BIN, mach will notice and prompt you to set up ready-made utilities that can be downloaded (for Linux or OSX only).
Putting it all together, if nothing is set up and all these components are needed, you might see something like this:
gbrown@mozpad:~/src$ ./mach robocop testLoad
No Android devices connected. Start an emulator? (Y/n) y
Fetching AVD. This may take a while...
Starting emulator running Android 4.3...
It looks like Firefox is not installed on this device.
Install Firefox? (Y/n) y
Installing Firefox. This may take a while...
Host utilities not found: environment variable MOZ_HOST_BIN is not set to a directory containing host xpcshell
Download and setup your host utilities? (Y/n) y
Installing host utilities. This may take a while...
…and then your tests will run!
Some people are concerned about all this prompting; they suggest just going ahead and doing the necessary steps rather than waiting for these Y/n questions to be answered. I see the appeal, but there are consequences. For example, you may have simply forgotten to connect your physical device and have no desire to download an AVD and run an emulator. Overall, I think it is best to prompt and it is easy to avoid most prompts if you wish:
mach android-emulator && mach install && mach <your test>
Happy testing!


October 16, 2015 08:39 PM
October 02, 2015
Firefox for Android has a UI Telemetry system. Here is an example of one of the ways we use it.
As you type a URL into Firefox for Android, matches from your browsing history are shown. We also display search suggestions from the default search provider. We also recently added support for displaying matches to previously entered search history. If any of these are tapped, with one exception, the term is used to load a search results page via the default search provider. If the term looks like a domain or URL, Firefox skips the search results page and loads the URL directly.

- This suggestion is not really a suggestion. It’s what you have typed. Tagged as
user.
- This is a suggestion from the search engine. There can be several search suggestions returned and displayed. Tagged as
engine.#
- This is a special search engine suggestion. It matches a domain, and if tapped, Firefox loads the URL directly. No search results page. Tagged as
url
- This is a matching search term from your search history. There can be several search history suggestions returned and displayed. Tagged as
history.#
Since we only recently added the support for search history, we want to look at how it’s being used. Below is a filtered view of the URL suggestion section of our UI Telemetry dashboard. Looks like history.# is starting to get some usage, and following a similar trend to engine.# where the first suggestion returned is used more than the subsequent items.
Also worth pointing out that we do get a non-trivial amount of url situations. This should be expected. Most search keyword data released by Google show that navigational keywords are the most heavily used keywords.
An interesting observation is how often people use the user suggestion. Remember, this is not actually a suggestion. It’s what the person has already typed. Pressing “Enter” or “Go” would result in the same outcome. One theory for the high usage of that suggestion is it provides a clear outcome: Firefox will search for this term. Other ways of trigger the search might be more ambiguous.

October 02, 2015 02:26 PM
September 29, 2015
A few months ago, Joel Maher announced the Perfherder summer of contribution. We wrapped things up there a few weeks ago, so I guess it’s about time I wrote up a bit about how things went.
As a reminder, the idea of summer of contribution was to give a set of contributors the opportunity to make a substantial contribution to a project we were working on (in this case, the Perfherder performance sheriffing system). We would ask that they sign up to do 5-10 hours of work a week for at least 8 weeks. In return, Joel and myself would make ourselves available as mentors to answer questions about the project whenever they ran into trouble.
To get things rolling, I split off a bunch of work that we felt would be reasonable to do by a contributor into bugs of varying difficulty levels (assigning them the bugzilla whiteboard tag ateam-summer-of-contribution). When someone first expressed interest in working on the project, I’d assign them a relatively easy front end one, just to cover the basics of working with the project (checking out code, making a change, submitting a PR to github). If they made it through that, I’d go on to assign them slightly harder or more complex tasks which dealt with other parts of the codebase, the nature of which depended on what they wanted to learn more about. Perfherder essentially has two components: a data storage and analysis backend written in Python and Django, and a web-based frontend written in JS and Angular. There was (still is) lots to do on both, which gave contributors lots of choice.
This system worked pretty well for attracting people. I think we got at least 5 people interested and contributing useful patches within the first couple of weeks. In general I think onboarding went well. Having good documentation for Perfherder / Treeherder on the wiki certainly helped. We had lots of the usual problems getting people familiar with git and submitting proper pull requests: we use a somewhat clumsy combination of bugzilla and github to manage treeherder issues (we “attach” PRs to bugs as plaintext), which can be a bit offputting to newcomers. But once they got past these issues, things went relatively smoothly.
A few weeks in, I set up a fortnightly skype call for people to join and update status and ask questions. This proved to be quite useful: it let me and Joel articulate the higher-level vision for the project to people (which can be difficult to summarize in text) but more importantly it was also a great opportunity for people to ask questions and raise concerns about the project in a free-form, high-bandwidth environment. In general I’m not a big fan of meetings (especially status report meetings) but I think these were pretty useful. Being able to hear someone else’s voice definitely goes a long way to establishing trust that you just can’t get in the same way over email and irc.
I think our biggest challenge was retention. Due to (understandable) time commitments and constraints only one person (Mike Ling) was really able to stick with it until the end. Still, I’m pretty happy with that success rate: if you stop and think about it, even a 10-hour a week time investment is a fair bit to ask. Some of the people who didn’t quite make it were quite awesome, I hope they come back some day.
—
On that note, a special thanks to Mike Ling for sticking with us this long (he’s still around and doing useful things long after the program ended). He’s done some really fantastic work inside Perfherder and the project is much better for it. I think my two favorite features that he wrote up are the improved test chooser which I talked about a few months ago and a get related platform / branch feature which is a big time saver when trying to determine when a performance regression was first introduced.
I took the time to do a short email interview with him last week. Here’s what he had to say:
1. Tell us a little bit about yourself. Where do you live? What is it you do when not contributing to Perfherder?
I’m a postgraduate student of NanChang HangKong university in China whose major is Internet of things. Actually,there are a lot of things I would like to do when I am AFK, play basketball, video game, reading books and listening music, just name it ; )
2. How did you find out about the ateam summer of contribution program?
well, I remember when I still a new comer of treeherder, I totally don’t know how to start my contribution. So, I just go to treeherder irc and ask for advice. As I recall, emorley and jfrench talk with me and give me a lot of hits. Then Will (wlach) send me an Email about ateam summer of contribution and perfherder. He told me it’s a good opportunity to learn more about treeherder and how to work like a team! I almost jump out of bed (I receive that email just before get asleep) and reply with YES. Thank you Will!
3. What did you find most challenging in the summer of contribution?
I think the most challenging thing is I not only need to know how to code but also need to know how treeherder actually work. It’s a awesome project and there are a ton of things I haven’t heard before (i.e T-test, regression). So I still have a long way to go before I familiar with it.
4. What advice would give you to future ateam contributors?
The only thing you need to do is bring your question to irc and ask. Do not hesitate to ask for help if you need it! All the people in here are nice and willing to help. Enjoy it!
September 29, 2015 03:37 PM
August 07, 2015
Since my last update, we’ve been trucking along with improvements to Perfherder, the project for making Firefox performance sheriffing and analysis easier.
Compare visualization improvements
I’ve been spending quite a bit of time trying to fix up the display of information in the compare view, to address feedback from developers and hopefully generally streamline things. Vladan (from the perf team) referred me to Blake Winton, who provided tons of awesome suggestions on how to present things more concisely.
Here’s an old versus new picture:
Summary of significant changes in this view:
- Removed or consolidated several types of numerical information which were overwhelming or confusing (e.g. presenting both numerical and percentage standard deviation in their own columns).
- Added tooltips all over the place to explain what’s being displayed.
- Highlight more strongly when it appears there aren’t enough runs to make a definitive determination on whether there was a regression or improvement.
- Improve display of visual indicator of magnitude of regression/improvement (providing a pseudo-scale showing where the change ranges from 0% – 20%+).
- Provide more detail on the two changesets being compared in the header and make it easier to retrigger them (thanks to Mike Ling).
- Much better and more intuitive error handling when something goes wrong (also thanks to Mike Ling).
The point of these changes isn’t necessarily to make everything “immediately obvious” to people. We’re not building general purpose software here: Perfherder will always be a rather specialized tool which presumes significant domain knowledge on the part of the people using it. However, even for our audience, it turns out that there’s a lot of room to improve how our presentation: reducing the amount of extraneous noise helps people zero in on the things they really need to care about.
Special thanks to everyone who took time out of their schedules to provide so much good feedback, in particular Avi Halmachi, Glandium, and Joel Maher.
Of course more suggestions are always welcome. Please give it a try and file bugs against the perfherder component if you find anything you’d like to see changed or improved.
Getting the word out
Hammersmith:mozilla-central wlach$ hg push -f try

pushing to ssh://hg.mozilla.org/try

no revisions specified to push; using . to avoid pushing multiple heads

searching for changes

remote: waiting for lock on repository /repo/hg/mozilla/try held by 'hgssh1.dmz.scl3.mozilla.com:8270'

remote: got lock after 4 seconds

remote: adding changesets

remote: adding manifests

remote: adding file changes

remote: added 1 changesets with 1 changes to 1 files

remote: Trying to insert into pushlog.

remote: Inserted into the pushlog db successfully.

remote:

remote: View your change here:

remote:   https://hg.mozilla.org/try/rev/e0aa56fb4ace

remote:

remote: Follow the progress of your build on Treeherder:

remote:   https://treeherder.mozilla.org/#/jobs?repo=try&revision=e0aa56fb4ace

remote:

remote: It looks like this try push has talos jobs. Compare performance against a baseline revision:

remote:   https://treeherder.mozilla.org/perf.html#/comparechooser?newProject=try&newRevision=e0aa56fb4ace
Try pushes incorporating Talos jobs now automatically link to perfherder’s compare view, both in the output from mercurial and in the emails the system sends. One of the challenges we’ve been facing up to this point is just letting developers know that Perfherder exists and it can help them either avoid or resolve performance regressions. I believe this will help.
Data quality and ingestion improvements
Over the past couple weeks, we’ve been comparing our regression detection code when run against Graphserver data to Perfherder data. In doing so, we discovered that we’ve sometimes been using the wrong algorithm (geometric mean) to summarize some of our tests, leading to unexpected and less meaningful results. For example, the v8_7 benchmark uses a custom weighting algorithm for its score, to account for the fact that the things it tests have a particular range of expected values.
To hopefully prevent this from happening again in the future, we’ve decided to move the test summarization code out of Perfherder back into Talos (bug 1184966). This has the additional benefit of creating a stronger connection between the content of the Talos logs and what Perfherder displays in its comparison and graph views, which has thrown people off in the past.
Continuing data challenges
Having better tools for visualizing this stuff is great, but it also highlights some continuing problems we’ve had with data quality. It turns out that our automation setup often produces qualitatively different performance results for the exact same set of data, depending on when and how the tests are run.
A certain amount of random noise is always expected when running performance tests. As much as we might try to make them uniform, our testing machines and environments are just not 100% identical. That we expect and can deal with: our standard approach is just to retrigger runs, to make sure we get a representative sample of data from our population of machines.
The problem comes when there’s a pattern to the noise: we’ve already noticed that tests run on the weekends produce different results (see Joel’s post from a year ago, “A case of the weekends”) but it seems as if there’s other circumstances where one set of results will be different from another, depending on the time that each set of tests was run. Some tests and platforms (e.g. the a11yr suite, MacOS X 10.10) seem particularly susceptible to this issue.
We need to find better ways of dealing with this problem, as it can result in a lot of wasted time and energy, for both sheriffs and developers. See for example bug 1190877, which concerned a completely spurious regression on the tresize benchmark that was initially blamed on some changes to the media code– in this case, Joel speculates that the linux64 test machines we use might have changed from under us in some way, but we really don’t know yet.
I see two approaches possible here:
- Figure out what’s causing the same machines to produce qualitatively different result distributions and address that. This is of course the ideal solution, but it requires coordination with other parts of the organization who are likely quite busy and might be hard.
- Figure out better ways of detecting and managing these sorts of case. I have noticed that the standard deviation inside the results when we have spurious regressions/improvements tends to be higher (see for example this compare view for the aforementioned “regression”). Knowing what we do, maybe there’s some statistical methods we can use to detect bad data?
For now, I’m leaning towards (2). I don’t think we’ll ever completely solve this problem and I think coming up with better approaches to understanding and managing it will pay the largest dividends. Open to other opinions of course!
August 07, 2015 08:04 PM
July 16, 2015
Bug 1175934 – [B2G] Add support to build blobfree images
has landed and is now available on task cluster :
https://tools.taskcluster.net/index/artifacts/#gecko.v1.mozilla-central.latest.linux.aries-blobfree/gecko.v1.mozilla-central.latest.linux.aries-blobfree.opt
What is Blob free? see https://developer.mozilla.org/en-US/Firefox_OS/Building#Building_a_blob_free_full_system_zip
That’s right. if you follow Bug 1166276 – (b2g-addon) [meta] Getting a B2G Installer Addon, you will see that there’s an addon to the desktop firefox version that will allow you to flash your device, and these blobfree images are to be available to the public.
\o/ Dev team!
Filed under:
B2G,
Gaia,
mobile,
Planet,
QA,
QMO Tagged:
B2G,
gaia,
mobile,
Planet,
QA,
QMO 

July 16, 2015 06:24 AM
July 15, 2015
Active projects
Here’s some of the projects I’m currently offering that are seeing active progress.
When it’s personal: Firefox Account profile avatars
Super-contributor /u/vivek has been working on all aspects of integrating Firefox Account profile
avatar images into Fennec. This work is broadly tracked in Bug 1150964, and there are lots of
pieces: network layer fetching; storage and caching; managing update broadcasts; and implementing
UI. This project is the first OAuth-authenticated Firefox Account service in Fennec (our native
Reading List implementation didn’t ship) and is likely to be the first WebChannel consumer in Fennec
as well!
This project is extra special to me because Vivek came to me and asked (in his usual under-stated
manner) if he could "do all the work" for this feature. Vivek and I had collaborated on a lot of
tickets, but I had been hoping to work with a contributor on a project scoped larger than one or two
tickets. This project is the first time that I have gotten to engage with a contributor on an
ongoing basis. Where we talked about expectations (for both of us!) and timelines up front. Where
I expect to turn maintainership of the code over to Vivek and he’s going to own it. And it is my
sincere hope that Vivek will mentor new contributors to improve that code.
Paying down technical debt: deprecating the android-sync clients database
Contributor /u/ahmedkhalil has been chewing through tickets that simplify the handling of clients
and tabs from other devices (as shown in Fennec’s Synced Tabs panel). This project isn’t as well
tracked as some of the other ones I’m writing about today, partly because I didn’t set the scope on
day one — Ahmed arrived at the tickets himself. And what a path! Ahmed and I started doing some
build system tickets (if you use the new mach artifact command to Build Fennec frontend fast
with mach artifact!, you’re using some of Ahmed’s AAR packaging code); and then we took a strange
and ultimately unsuccessful trip into bookmark exporting; and then we did some other minor tickets.
I fully expect Ahmed to push into the dark corners of the Fennec Sync implementation and refactor
some of our oldest, least touched code in the clients engine. I got Ahmed into this with the lure
of front-end user-visible Synced Tabs improvements and he may end up in the least user-visible part
of the code base!
Understanding the Fennec connected experience: Sync metrics
The Fennec Sync product is a "mature product", if by mature you mean that nobody modifies the code.
However, the newly revitalized Sync team (bandleader: Chris Karlof) is leading a wide-ranging
project to understand the Sync experience across Firefox products. This will be a qualitative and
quantitative project, and I’m partnering with new contributor @aminban to collect quantitative
metrics about Fennec Sync on Android. This work is broadly tracked at Bug 1180321. This is a very
paralellizable project; most of the individual tickets are independent of each other. I’m hoping
to work with Amin on a few tickets and then have him help mentor additional contributors to flesh
out the rest of the work.
Help wanted
But I also have some projects in the hopper that need … a certain set of skills.
Plain Old Java Projects
These are projects for front-end developers that require Java (and maybe JavaScript) skills.
- The Firefox Accounts team had an idea to email QR codes to make it easier for Fennec users to
connect to their Firefox Account. I made some notes and tracked the idea at Bug 1178364. It’s a
wide ranging project that might need some co-ordination with the Firefox Accounts team, but I work
with those folks frequently and we can make it happen. This is a really interesting project with
lots of moving pieces. It needs Java and some JavaScript skills, and the ability to get creative
while testing.
- I’ve been talking to /u/anatal about implementing the WebSpeech API in Fennec. André has plans to
develop an offline (meaning, on the device) implementation, but shipping such an implementation
in Fennec is hard due to the size of the model files required. An online implementation that
used Google’s Android Speech implementation would be easier to ship. This would be a really
interesting project because you’d be implementing a web API exposed to web content! That is,
you’d actually be building the web platform. You’d need some Java and JavaScript skills;
preferably some experience with the Android Speech APIs; and we’d both learn some Gecko web engine
internals and read a lot of W3C specifications.
Engagement Projects
These projects might not end up in the Fennec codebase, but they’re valuable and require folks with
special skills.
- I want to expose better metrics about the Fennec team’s contributor experience. I hate to say the
word dashboard but… a dashboard! Tracking things like number of new tickets created in the
Firefox for Android component, number of new mentor tickets, number of new good first bugs, number
of new contributors arriving, etc. I think most of this can be extracted from Bugzilla with some
clever queries, but I don’t really know how to do it, and I really don’t know how to display the
data in a useful form. This might be a simple client-side web page that does some Bugzilla Rest
API queries and uses d3.js or
similar to format the results. Or it could be a set of Mediawiki <bugzilla> queries that we
can put in the mobile team weekly meeting notes. This
is really open-ended and could grow into a larger community engagement role with the Fennec team.
- I want to do some Android community outreach to understand barriers to Fennec (code) contribution.
I’m aware that not building on Windows is probably a big deal (Bug 1169873), but I don’t know how
big a deal. And I’m aware (painfully!) of how awkward it is to get started with Fennec, but I
don’t know which parts Android developers find the worst. (For example: these developers probably
have the Android SDK (if not the Android NDK) installed already.) This might look like a "Getting
started with Fennec development" session in your location. But I’d also like to know how Android
developers feel about Fennec as a product, and whether Android developers are even interested in
the web in the way that Mozilla is representing. If you are connected to Android developers
(maybe through a meetup group?) and would be interested in doing some outreach, contact me.
Build system Projects
Build system hackers are a rare breed. But there’s so much low-hanging fruit here that can make a
big difference to our daily development.
- I have several Gradle-related build tickets. I want to get rid of mach gradle-install, and
make it so that every Fennec build has an automatically maintained Gradle configuration without
additional commands. Part of this will be making the Gradle configuration more dynamic, so that
you don’t have to run mach package before running mach gradle-install. I’d like to find a
way to share bits of the .idea directory. I’d like to move the Gradle configuration files out
of the object directory, so that clobber builds don’t destroy your Gradle configuration. These
projects require Python skills.
- I have lots of mach artifact follow-up tickets. Read Build Fennec frontend fast with mach
artifact! to get an idea of what mach artifact is, but in a nutshell it downloads and caches
binary artifacts built in Mozilla automation so that you don’t have to compile C++ to build
Fennec. It turns a 20 minute build into a 5 minute build. I’d like to support git, and improve
the caching layer, and make the system more configurable, and support Desktop front-end builds,
and… These projects require Python skills.
- I want to move build/mobile/robocop into mobile/android/tests/browser/robocop. And
convert it to moz.build. This will both making testing better (no more forgetting to build
Robocop!) and it also make it easier to conditionally compile tests. If you’re interested, start
with Bug 938659 and Bug 1180104. This project requires basic Make and Python skills.
Changes
- Sun 5 July 2015: Initial version.
Notes
July 15, 2015 10:00 PM
July 14, 2015
Haven’t been doing enough blogging about Perfherder (our project to make Talos and other per-checkin performance data more useful) recently. Let’s fix that. We’ve been making some good progress, helped in part by a group of new contributors that joined us through an experimental “summer of contribution” program.
Comparison mode
Inspired by Compare Talos, we’ve designed something similar which hooks into the perfherder backend. This has already gotten some interest: see this post on dev.tree-management and this one on dev.platform. We’re working towards building something that will be really useful both for (1) illustrating that the performance regressions we detect are real and (2) helping developers figure out the impact of their changes before they land them.

|

|
Most of the initial work was done by Joel Maher with lots of review for aesthetics and correctness by me. Avi Halmachi from the Performance Team also helped out with the t-test model for detecting the confidence that we have that a difference in performance was real. Lately myself and Mike Ling (one of our summer of contribution members) have been working on further improving the interface for usability — I’m hopeful that we’ll soon have something implemented that’s broadly usable and comprehensible to the Mozilla Firefox and Platform developer community.
Graphs improvements
Although it’s received slightly less attention lately than the comparison view above, we’ve been making steady progress on the graphs view of performance series. Aside from demonstrations and presentations, the primary use case for this is being able to detect visually sustained changes in the result distribution for talos tests, which is often necessary to be able to confirm regressions. Notable recent changes include a much easier way of selecting tests to add to the graph from Mike Ling and more readable/parseable urls from Akhilesh Pillai (another summer of contribution participant).

Performance alerts
I’ve also been steadily working on making Perfherder generate alerts when there is a significant discontinuity in the performance numbers, similar to what GraphServer does now. Currently we have an option to generate a static CSV file of these alerts, but the eventual plan is to insert these things into a peristent database. After that’s done, we can actually work on creating a UI inside Perfherder to replace alertmanager (which currently uses GraphServer data) and start using this thing to sheriff performance regressions — putting the herder into perfherder.
As part of this, I’ve converted the graphserver alert generation code into a standalone python library, which has already proven useful as a component in the Raptor project for FirefoxOS. Yay modularity and reusability.
Python API
I’ve also been working on creating and improving a python API to access Treeherder data, which includes Perfherder. This lets you do interesting things, like dynamically run various types of statistical analysis on the data stored in the production instance of Perfherder (no need to ask me for a database dump or other credentials). I’ve been using this to perform validation of the data we’re storing and debug various tricky problems. For example, I found out last week that we were storing up to duplicate 200 entries in each performance series due to double data ingestion — oops.
You can also use this API to dynamically create interesting graphs and visualizations using ipython notebook, here’s a simple example of me plotting the last 7 days of youtube.com pageload data inline in a notebook:

[original]
July 14, 2015 08:51 PM
July 05, 2015
The part of my job that is special — the part I wouldn’t get working away from Mozilla — is
enabling community code contributors to participate in and own the direction of Fennec (Firefox for
Android). There are so many ways to contribute to
Mozilla, but this post I’ll limit myself to Fennec code contribution because it’s the on-ramp that the Fennec
team has put the most effort into, and it’s my own personal cause.
In part the second, I give a project status update and advertise a variety of new projects to the
community. If you’re interested, contact me!
New contributors
Mozilla’s very own @mhoye has been very active encouraging new contributors. Mike (and others —
I’m looking at you, @lastontheboat) pioneered marking tickets as [good first bugs]; and pushed to add
the mentor field to Bugzilla; and maintains @StartMozilla. Mike works tirelessly to widen the
funnel of new contributors approaching the Mozilla project. In large part Mike’s internal
evangelism has worked: we think we know some things that work to help people make their first contribution:
- we have improved our on-boarding documentation;
- we have made it easier to build Fennec the first time (mach bootstrap) and to read the code
base (Gradle integration);
- we have made it easier to find [good first bug] tickets and mentors;
- and we have committed to making #mobile a friendly, welcoming space for potential contributors.
We’re now looking to grow our existing contributors. How do we work with contributors to move them
from "new arrival" to "valued contributor"? What’s the value exchange?
Capturing unicorns
I’ve been thinking about this for a few years now. Mobile team — which really means Fennec team,
since the Firefox for iOS is very new — has captured some unicorns . I’m thinking of
/u/capella, who is de-facto owner of the Fennec input front-end code, and /u/vivek — if I didn’t
include someone, it wasn’t intentional. We’re truly lucky to have had the benefit of their
contributions for as long as we have. But we don’t really understand how we caught them. And the
thing about unicorns is that you only need to capture one unicorn to look like a great unicorn
hunter. Mobile team is right at that point: we’ve had some success attracting code contributors,
but we don’t really know how we did it — and we don’t have a strategy to attract more.
Recently I’ve had success attracting and retaining high-value code contributors with the following
tactic. I’ve started offering medium-sized projects that let me and a contributor collaborate on an
area of the code base over time. By medium-sized I really mean not just a [good first bug] or a
[good next bug]; I mean an area of work that’s somewhat open-ended and will develop deeper expertise
in at least one part of the code base. (I’m trying to keep these projects well-scoped, but that’s a
battle for me as an engineer: scoping work is hard.) I mean a few things by high-value code
contributor: principally, a repeat contributor who might grow into a reviewer and module peer.
This approach requires some up-front work on my part. It’s not easy writing a bug with enough
context to be meaningful to someone without deep context into how Fennec is built and where our team
strategy is leading us. It’s not easy to file dependent tickets that are correctly "chunked", and
to provide enough links and technical details to guide a reasonable implementation. It’s especially
not easy trying to anticipate high-level problems in parts of the code that I myself don’t know much
(or anything!) about.
But the reward can be great. High-value contributors have time and skills that we want. In
exchange, they want things: experience; an opportunity to work with excellent engineers; the chance
to contribute to the Open Web; references; etc. The folks with that mix need to be challenged; they
need to see that their contribution leads somewhere: to an implemented feature, to a performance
improvement, to a better future. I want to give a pathway to that future. Contributions on-ramps
need to lead to contribution in-roads.
On a purely practical level, after mentoring a [good first bug] to completion, it’s really hard to
find a [good next bug]! Often, there’s nothing in the same or a similar area. Or there’s no ticket
(that I know about!) that is a reasonable challenge. And as a contributor, there’s no satisfaction
in fixing typos or doing trivial variable substitutions more than once or twice. With a scoped
project somewhat specified up front, I always have at least an idea of what could come next.
I haven’t yet tried to make one of these projects self-contained, in the sense of having a [good
first bug], and then some [good next bugs], and then some meatier implementation details. But I
think it’s a reasonable model and I intend to try it.
Other thoughts
There’s so much more to this discussion. I think some of my success retaining contributors is that
I put in a lot of time in #mobile answering questions. I get to know the people I work with —
where they live, what they do every day, what kinds of change they want to see in the project. I’ll
reach out to them if I find tickets that are good fits for them. If I could scale this high-touch
approach, I would!
I don’t claim to know much about our contributor motivations. I think we do a good job of
recognizing our contributors inside our team but an absolutely terrible job recognizing our
contributors in the Mozilla community and in the larger Android community. We have essentially no
formal mentoring (outside of internships, which are paid) or formal recognition (such as writing
letters of recommendation). I day-dream about a "new contributor survey" that would quickly let us
learn about our community and match contributors to mentors, tickets, and the outcomes that they want.
I’m really interested in understanding the health of our contributor community. We know that
keeping the pipeline of [good first bugs] and mentored tickets wide helps, but we don’t measure that
flow. That’s all looking inwards, to our own community. What if we looked outwards? How much
would outreach to targeted Android communities, projects, and even specific developers help? Could
we further Fennec’s mission by targeting key web projects and developers? Could we attract key
people to evangelize Fennec? We don’t know.
Finally, I haven’t really seen this approach used in other parts of Mozilla, although I hear
rumblings that @redheadedcuban and the A-Team do something like this. If your team does this, let
me know!
Changes
- Sun 5 July 2015: Initial version.
Notes
July 05, 2015 10:00 PM
July 03, 2015
Nota bene: this post supercedes Build Fennec frontend fast!
Quick start
It’s easy! But there is a pre-requisite: you need to enable Gregory Szorc’s mozext Mercurial
extension first. mozext is part of Mozilla’s version-control-tools repository; run
mach mercurial-setup to make sure your local copy is up-to-date, and then add the following to
the .hg/hgrc file in your source directory:
[extensions]
mozext = /PATH/TO/HOME/.mozbuild/version-control-tools/hgext/mozext
Then, run hg pushlogsync. Mercurial should show a long (and slow) progress bar .
From now on, each time you hg pull, you’ll also maintain your local copy of the pushlog.
Now, open your mozconfig file and add:
ac_add_options --disable-compile-environment
mk_add_options MOZ_OBJDIR=./objdir-frontend
(That last line uses a different object directory — it’s worth experimenting with a different
directory so you can go back to your old flow if necessary.)
Then mach build and mach build mobile/android as usual. When it’s time to package an APK, use:
mach artifact install && mach package
instead of mach package . Use mach install like normal to deploy to your device!
After running mach artifact install && mach package once, you should find that mach
gradle-install, mach gradle app:installDebug, and developing with IntelliJ (or Android Studio)
work like normal as well.
Disclaimer
This only works when you are building Fennec (Firefox for Android) and developing JavaScript and/or
Fennec frontend Java code! If you’re building Firefox for Desktop, this won’t help you. If you’re
building C++ code, this won’t help you.
The integration currently requires Mercurial. Mozilla’s release engineering runs a service mapping
git commit hashes to Mercurial commit hashes; mach artifact should be able to use this service
to provide automatic binary artifact management for git users.
Discussion
mach artifact install is your main entry point: run this to automatically inspect your local
repository, determine good candidate revisions, talk to the Task Cluster index service to identify
suitable build artifacts, and download them from Amazon S3. The command caches heavily, so it
should be fine to run frequently; and the command avoids touching files except when necessary, so it
shouldn’t invalidate builds arbitrarily.
The reduction in build time comes from --disable-compile-environment: this tells the build
system to never build C++ libraries (libxul.so and friends) . On my laptop, a
clobber build with this configuration completes in about 3 minutes . This
configuration isn’t well tested, so please file tickets blocking Bug 1159371.
Troubleshooting
Run mach artifact to see help.
I’m seeing problems with pip
Your version of pip may be to old. Upgrade it by running pip install --upgrade pip.
I’m seeing problems with hg
Does hg log -r pushhead('fx-team') work? If not, there’s a problem with your mozext configuration.
Check the pre-requisites again.
What version of the downloaded binaries am I using?
mach artifact last displays the last artifact installed. You can see the local file name; the
URL the file was fetched from; the Task Cluster job URL; and the corresponding Mercurial revision
hash. You can use this to get some insight into the system.
Where are the downloaded binaries cached?
Everything is cached in ~/.mozbuild/package-frontend. The commands purge old artifacts as new
artifacts are downloaded, keeping a small number of recently used artifacts.
I’m seeing weird errors and crashes!
Since your local build and the upstream binaries may diverge, lots of things can happen. If the
upstream binaries change a C++ XPCOM component, you may see a binary incompatibility. Such a
binary incompatibility looks like:
E GeckoConsole(5165) [JavaScript Error: "NS_ERROR_XPC_GS_RETURNED_FAILURE: Component returned failure code: 0x80570016 (NS_ERROR_XPC_GS_RETURNED_FAILURE) [nsIJSCID.getService]" {file: "resource://gre/modules/Services.jsm" line: 23}]
You should update your tree (using hg pull -u --rebase or similar) and run mach build && mach
artifact install && mach package again.
How can I help debug problems?
There are two commands to help with debugging: print-cache and clear-cache. You
shouldn’t need either; these are really just to help me debug issues in the wild.
Acknowledgements
This work builds on the contributions of a huge number of people. First, @indygreg supported this
effort from day one and reviewed the code. He also wrote mozext and made it easy to access the
pushlog locally. None of this happens without Greg. Second, the Task Cluster Index team deserves
kudos for making it easy to download artifacts built in automation. Anyone who’s written a TBPL
scraper knows how much better the new system is. Third, I’d like to thank @liucheia for testing
this with me in Whistler, and /u/vivek for proof-reading this blog post.
Conclusion
In my blog post The Firefox for Android build system in 2015, the first priority was making it
easier to build Firefox for Android the first time. The second priority was reducing the
edit-compile-test cycle time. The mach artifact work described here drastically reduces the
first compile-test cycle time, and subsequent compile-test cycles after pulling from the upstream
repository. It’s hitting part of the first priority, and part of the second priority. Baby steps.
The Firefox for Android team is always making things better for contributors! Get involved with
Firefox for Android.
Discussion is best conducted on the mobile-firefox-dev mailing list and I’m nalexander on
irc.mozilla.org/#mobile and @ncalexander on Twitter.
Changes
- Wed 1 July 2015: Initial version.
- Mon 6 July 2015: fix typo in link to Vivek. Thanks, sfink!
Notes
July 03, 2015 03:30 AM
May 31, 2015
At the start of 2014, I became a "manager". At least in the sense that I had a couple of people reporting to me. Like most developers-turned-managers I was unsure if management was something I wanted to do but I figured it was worth trying at least. Somebody recommended the book First, Break All The Rules to me as a good book on management, so I picked up a copy and read it.
The book is based on data from many thousands of interviews and surveys that the Gallup organization did, across all sorts of organizations. There were lots of interesting points in the book, but the main takeaway relevant here was that people who build on their strengths instead of trying to correct their weaknesses are generally happier and more successful. This leads to some obvious follow-up questions: how do you know what your strengths are? What does it mean to "build on your strengths"?
To answer the first question I got the sequel, Now, Discover Your Strengths, which includes a single-use code for the online StrengthsFinder assessment. I read the book, took the assessment, and got a list of my top 5 strengths. While interesting, the list was kind of disappointing, mostly because I didn't really know what to do with it. Perhaps the next book in the series, Go Put Your Strengths To Work, would have explained but at this point I was disillusioned and didn't bother reading it.
Fast-forward to a month ago, when I finally got to attend the first TRIBE session. I'd heard good things about it, without really knowing anything specific about what it was about. Shortly before it started though, they sent us a copy of Strengths Based Leadership, which is a book based on the same Gallup data as the aforementioned books, and includes a code to the 2.0 version of the same online StrengthsFinder assessment. I read the book and took the new assessment (3 of the 5 strengths I got matched my initial results; the variance is explained on their FAQ page) but didn't really end up with much more information than I had before.
However, the TRIBE session changed that. It was during the session that I learned the answer to my earlier question about what it means to "build on strengths". If you're familiar with the 4 stages of competence, that TRIBE session took me from "unconscious incompetence" to "conscious incompetence" with regard to using my strengths - it made me aware of when I'm using my strengths and when I'm not, and to be more purposeful about when to use them. (Two asides: (1) the TRIBE session also included other useful things, so I do recommend attending and (2) being able to give something a name is incredibly powerful, but perhaps that's worth a whole 'nother blog post).
At this point, I'm still not 100% sure if being a manager is really for me. On the one hand, the strengths I have are not really aligned with the strengths needed to be a good manager. On the other hand, the Strengths Based Leadership book does provide some useful tips on how to leverage whatever strengths you do have to help you fulfill the basic leadership functions. I'm also not really sold on the idea that your strengths are roughly constant over your lifetime. Having read about neuroplasticity I think your strengths might change over time just based on how you live and view your life. That's not really a case for or against being a manager or leader, it just means that you'd have to be ready to adapt to an evolving set of strengths.
Thankfully, at Mozilla, unlike many other companies, it is possible to "grow" without getting pushed into management. The Mozilla staff engineer level descriptions provide two tracks - one as an individual contributor and one as a manager (assuming these descriptions are still current - and since the page was last touched almost 2 years ago it might very well not be!). At many companies this is not even an option.
For now I'm going to try to level up to "conscious competence" with respect to using my strengths and see where that gets me. Probably by then the path ahead will be more clear.
May 31, 2015 06:07 PM
May 06, 2015
Nota bene: this post has been superceded by Build Fennec frontend fast with mach artifact!
Quick start
Temporarily, you’ll need to pull the new mach command into your source tree:
$ hg pull -r 3c0fb13b77b8460e56a31054a5f005bb3e4cdda1 https://reviewboard-hg.mozilla.org/gecko/
$ hg up 3c0fb13b77b8460e56a31054a5f005bb3e4cdda1
$ hg rebase -d fx-team
It’s easy! Open your mozconfig file and add:
ac_add_options --disable-compile-environment
You might want to also use a different object directory:
mk_add_options MOZ_OBJDIR=./objdir-frontend
Then mach build and mach build mobile/android as usual. When it’s time to package an APK, use:
instead of mach package. Use mach install like normal to deploy to your device!
After running mach package-frontend once, mach gradle-install, mach gradle
app:installDebug, and developing with IntelliJ (or Android Studio) work as well.
Disclaimer
This only works when you are building Fennec (Firefox for Android) and developing JavaScript and/or
Fennec frontend Java code!
You have been warned.
Options
mach package-frontend takes a couple of options that let you control downloading:
--force-remote-binaries, -r
Download and use remote binaries without comparing local and remote timestamps.
--force-local-binaries, -l
Do not download remote binaries; use local cached binaries.
Troubleshooting
What version of the downloaded binaries am I using?
Look in ~/.mozbuild/package-frontend/stage/assets/fennec-*.json for build ID, timestamps, and
additional configuration.
I’m seeing weird errors and crashes!
Since your local build and the upstream binaries may diverge, lots of things can happen. If the
upstream binaries change a C++ XPCOM component, you may see a binary incompatibility. Such a
binary incompatibility looks like:
E GeckoConsole(5165) [JavaScript Error: "NS_ERROR_XPC_GS_RETURNED_FAILURE: Component returned failure code: 0x80570016 (NS_ERROR_XPC_GS_RETURNED_FAILURE) [nsIJSCID.getService]" {file: "resource://gre/modules/Services.jsm" line: 23}]
You should update your tree (using hg pull -u --rebase or similar) and run mach build && mach
package-frontend again.
Technical details
There are two things happening here. The reduction in build time comes from
--disable-compile-environment: this tells the build system to never build C++ libraries
(libxul.so and friends) . On my laptop, a clobber build with this configuration
completes in about 3 minutes . This configuration isn’t well tested, so please file
tickets blocking Bug 1159371.
The new mach package-frontend downloads pre-built binaries , copies them into your
object directory, and then runs the regular packaging code to include them in an APK. This new mach
command is tracked at Bug 1162191. A successful run looks something like:
$ ./mach package-frontend
 0:00.23 wget --timestamping --quiet --recursive --level=1 --no-directories --no-parent --accept fennec-*.en-US.android-arm.txt http://ftp.mozilla.org/pub/mozilla.org/mobile/nightly/latest-mozilla-central-android-api-11/en-US/
 0:00.82 wget --timestamping http://ftp.mozilla.org/pub/mozilla.org/mobile/nightly/latest-mozilla-central-android-api-11/en-US/geckolibs-20150506030206.aar
--2015-05-06 16:20:13--  http://ftp.mozilla.org/pub/mozilla.org/mobile/nightly/latest-mozilla-central-android-api-11/en-US/geckolibs-20150506030206.aar
Resolving ftp.mozilla.org... 63.245.215.56, 63.245.215.46
Connecting to ftp.mozilla.org|63.245.215.56|:80... connected.
HTTP request sent, awaiting response... 200 OK
Length: 22891694 (22M) [text/plain]
Saving to: ‘geckolibs-20150506030206.aar’

100%[=======================================================================================>] 22,891,694  3.84MB/s   in 11s

2015-05-06 16:20:25 (1.93 MB/s) - ‘geckolibs-20150506030206.aar’ saved [22891694/22891694]
 0:12.20 unzip -u /Users/nalexander/.mozbuild/package-frontend/geckolibs-20150506030206.aar -d /Users/nalexander/.mozbuild/package-frontend/stage
 0:12.37 /Users/nalexander/Mozilla/gecko/objdir-droid/_virtualenv/bin/python /Users/nalexander/Mozilla/gecko/python/mozbuild/mozbuild/action/process_install_manifest.py --no-remove --no-remove-all-directory-symlinks --no-remove-empty-directories /Users/nalexander/Mozilla/gecko/objdir-droid/dist/bin /Users/nalexander/.mozbuild/package-frontend/geckolibs.manifest
From /Users/nalexander/Mozilla/gecko/objdir-droid/dist/bin: Kept 12 existing; Added/updated 0; Removed 0 files and 0 directories.
 0:12.51 /usr/bin/make -C . -j8 -s -w package
 0:13.00 make: Entering directory `/Users/nalexander/Mozilla/gecko/objdir-droid'
 0:13.04 make[1]: Entering directory `/Users/nalexander/Mozilla/gecko/objdir-droid/mobile/android/installer'
 0:13.57 make[2]: Entering directory `/Users/nalexander/Mozilla/gecko/objdir-droid/mobile/android/installer'
 0:14.02 make[3]: Entering directory `/Users/nalexander/Mozilla/gecko/objdir-droid/mobile/android/installer'
 <snip>
 0:29.88 make: Leaving directory `/Users/nalexander/Mozilla/gecko/objdir-droid'
 0:29.89 /usr/local/bin/terminal-notifier -title Mozilla Build System -group mozbuild -message Packaging complete
If the upstream binaries haven’t changed, new binaries aren’t downloaded, so it’s reasonable to use
mach package-frontend as a drop-in replacement for mach package:
$ ./mach package-frontend
 0:00.23 wget --timestamping --quiet --recursive --level=1 --no-directories --no-parent --accept fennec-*.en-US.android-arm.txt http://ftp.mozilla.org/pub/mozilla.org/mobile/nightly/latest-mozilla-central-android-api-11/en-US/
 0:00.52 wget --timestamping http://ftp.mozilla.org/pub/mozilla.org/mobile/nightly/latest-mozilla-central-android-api-11/en-US/geckolibs-20150506030206.aar
--2015-05-06 16:27:02--  http://ftp.mozilla.org/pub/mozilla.org/mobile/nightly/latest-mozilla-central-android-api-11/en-US/geckolibs-20150506030206.aar
Resolving ftp.mozilla.org... 63.245.215.46, 63.245.215.56
Connecting to ftp.mozilla.org|63.245.215.46|:80... connected.
HTTP request sent, awaiting response... 200 OK
Length: 22891694 (22M) [text/plain]
Server file no newer than local file ‘geckolibs-20150506030206.aar’ -- not retrieving.
 0:00.58 unzip -u /Users/nalexander/.mozbuild/package-frontend/geckolibs-20150506030206.aar -d /Users/nalexander/.mozbuild/package-frontend/stage
 0:00.59 /Users/nalexander/Mozilla/gecko/objdir-droid/_virtualenv/bin/python /Users/nalexander/Mozilla/gecko/python/mozbuild/mozbuild/action/process_install_manifest.py --no-remove --no-remove-all-directory-symlinks --no-remove-empty-directories /Users/nalexander/Mozilla/gecko/objdir-droid/dist/bin /Users/nalexander/.mozbuild/package-frontend/geckolibs.manifest
From /Users/nalexander/Mozilla/gecko/objdir-droid/dist/bin: Kept 12 existing; Added/updated 0; Removed 0 files and 0 directories.
 0:00.72 /usr/bin/make -C . -j8 -s -w package
 0:01.25 make: Entering directory `/Users/nalexander/Mozilla/gecko/objdir-droid'
 <snip>
 0:17.30 /usr/local/bin/terminal-notifier -title Mozilla Build System -group mozbuild -message Packaging complete
Conclusion
In my blog post The Firefox for Android build system in 2015, the first priority was making it
easier to build Firefox for Android the first time. So I landed mach bootstrap for Fennec, and
we turned an onerous process into a one-liner that works for most people . The second
priority was reducing the edit-compile-test cycle time. The work described here drastically reduces
the first compile-test cycle time, and subsequent compile-test cycles after pulling from the
upstream tree. It’s hitting part of the first priority, and part of the second priority. Baby steps.
The Firefox for Android team is always making things better for contributors! Get involved with
Firefox for Android.
Discussion is best conducted on the mobile-firefox-dev mailing list and I’m nalexander on
irc.mozilla.org/#mobile and @ncalexander on Twitter.
Changes
- Fri 8 May 2015: Thanks @michaelcomella for pointing out a bad Bugzilla ticket number.
Notes
May 06, 2015 09:30 AM


